
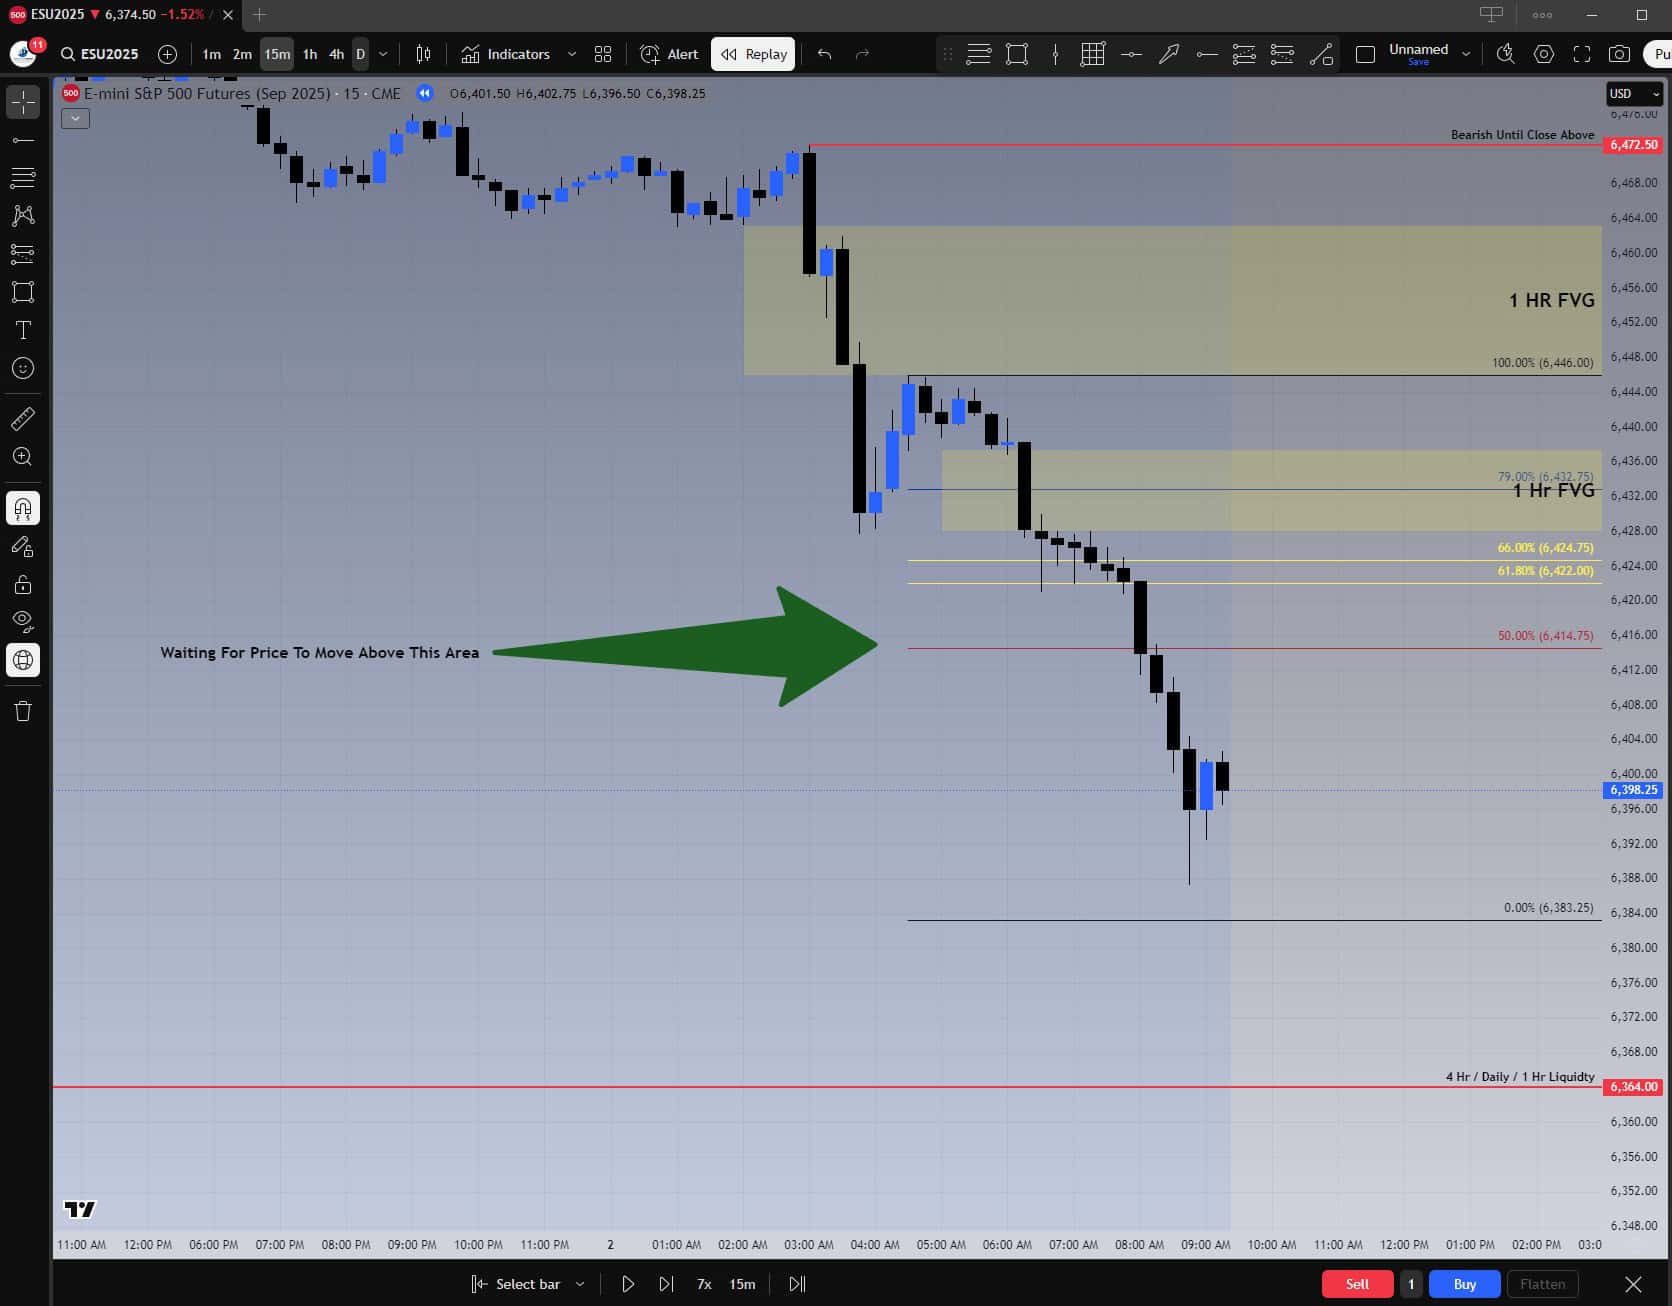
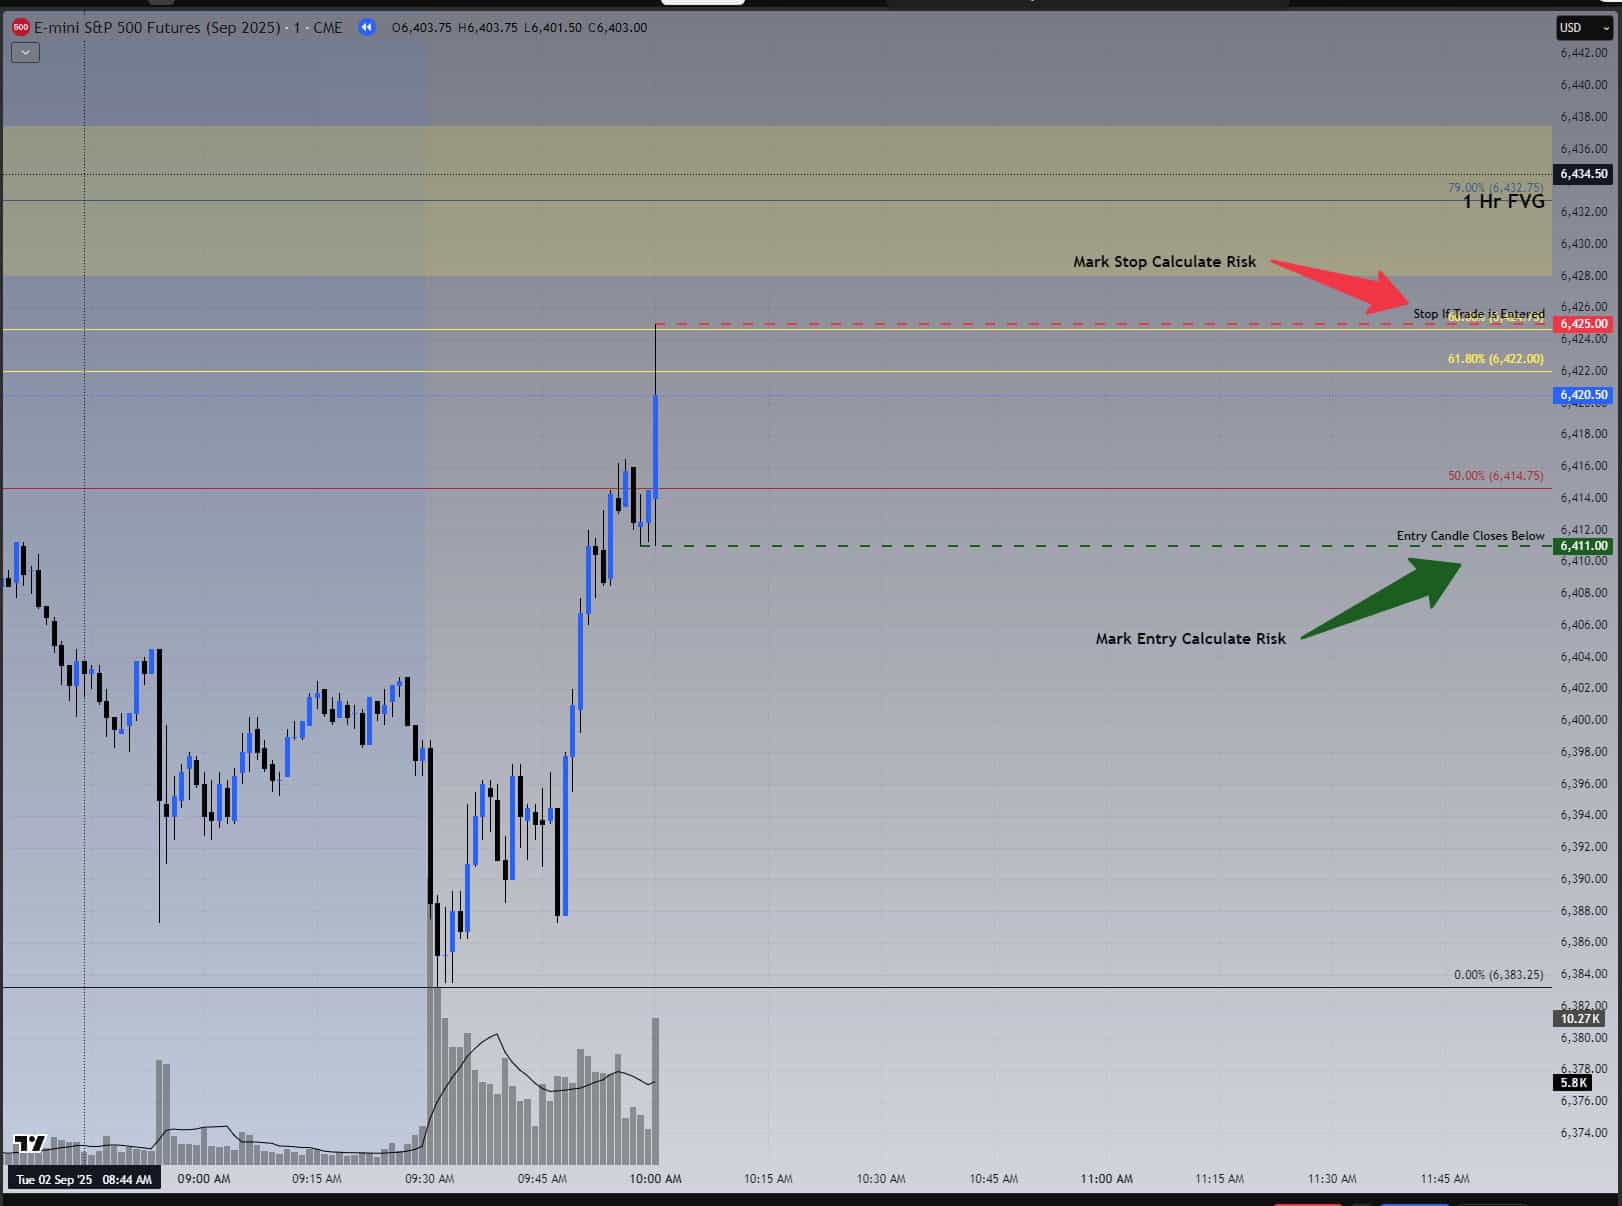
1) Pre-Bell Setup: defining the levels
Before the bell, I map out my high-probability areas. On this chart, I’ve marked multiple fair value gaps (FVGs), one-hour and four-hour liquidity, and a 15-minute Fibonacci retracement. The plan for the day was bearish, which meant I would sit on my hands until price retraced into a level worth trading. The green arrow highlights the zone where I wanted to see price move before considering an entry.
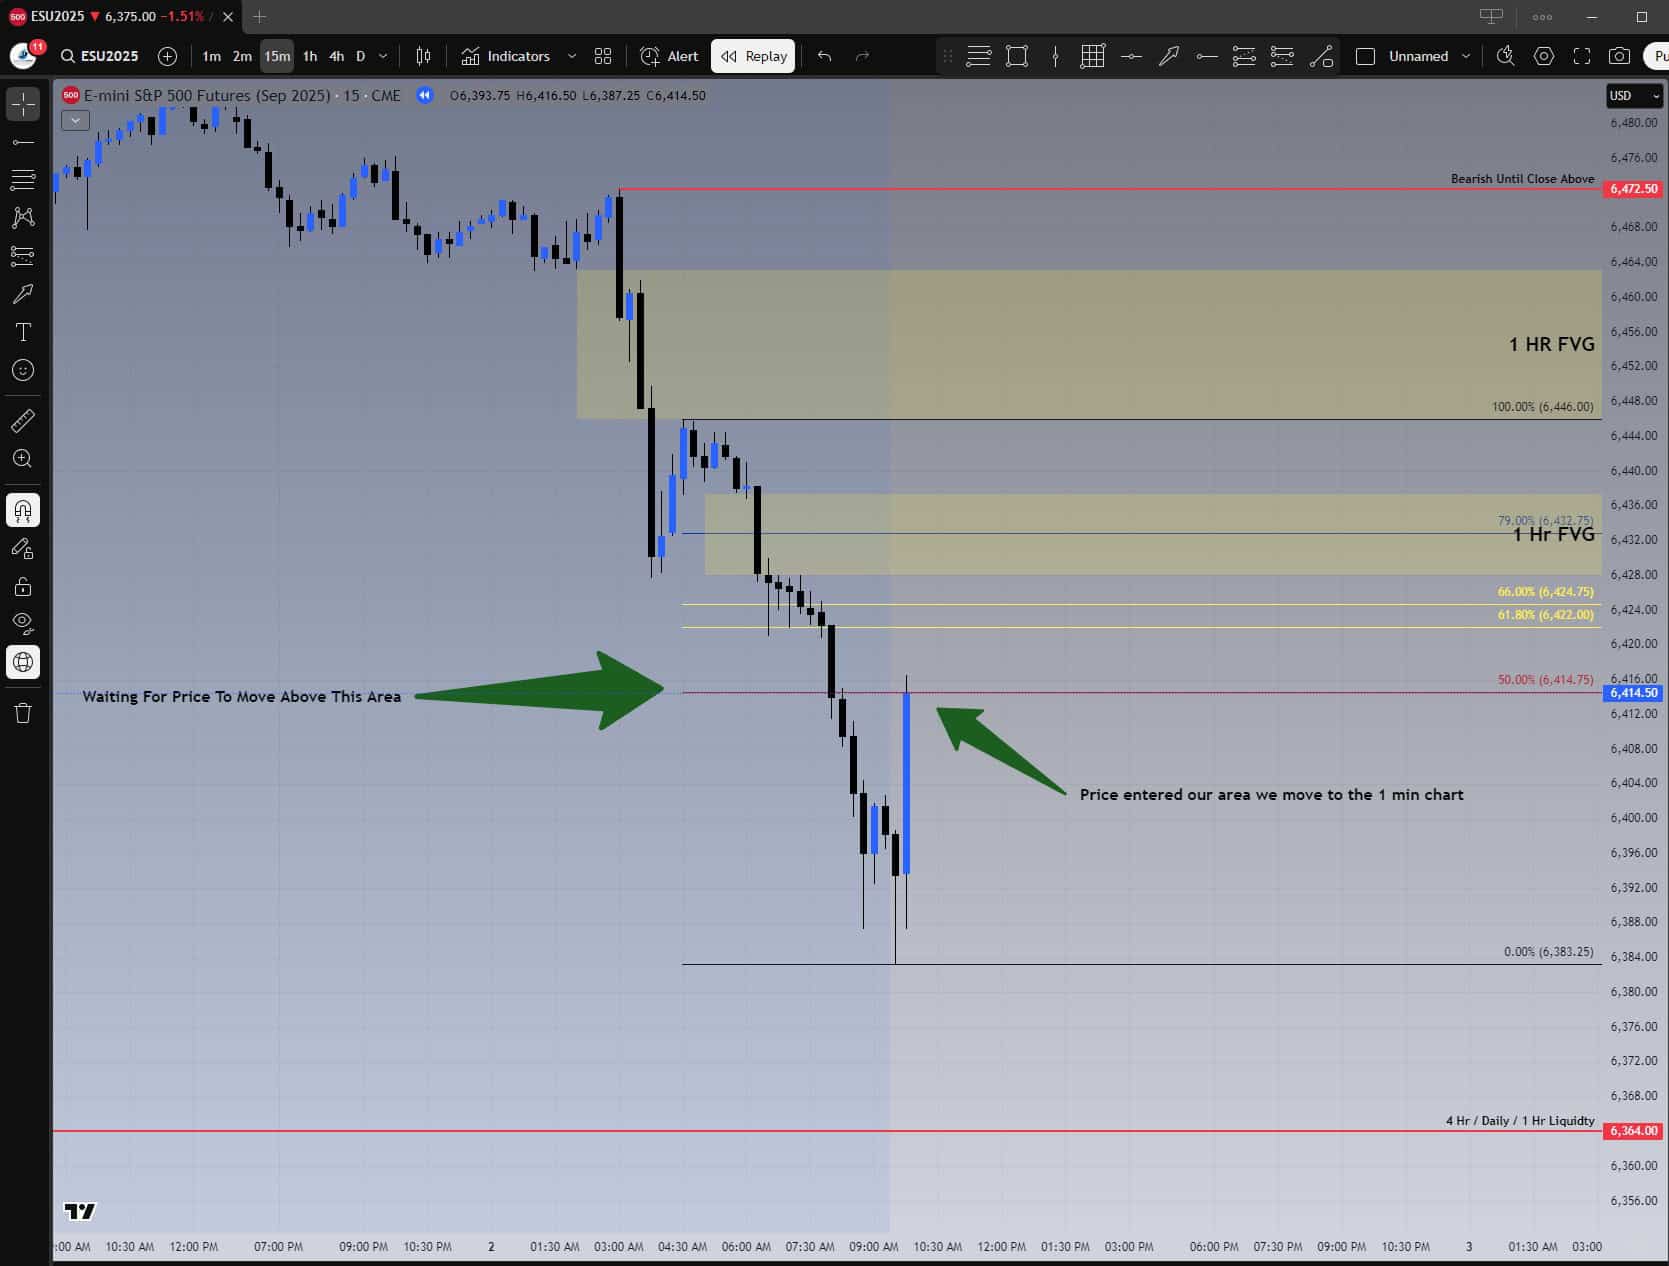
2) Price Enters the Zone
Patience pays. On the 15-minute chart, price poked into the high-probability zone we marked pre-bell. Two green arrows show (1) the original “waiting” area, and (2) confirmation that price has entered the zone. This is when the plan shifts: drop down to the 1-minute chart to stalk precise entry.
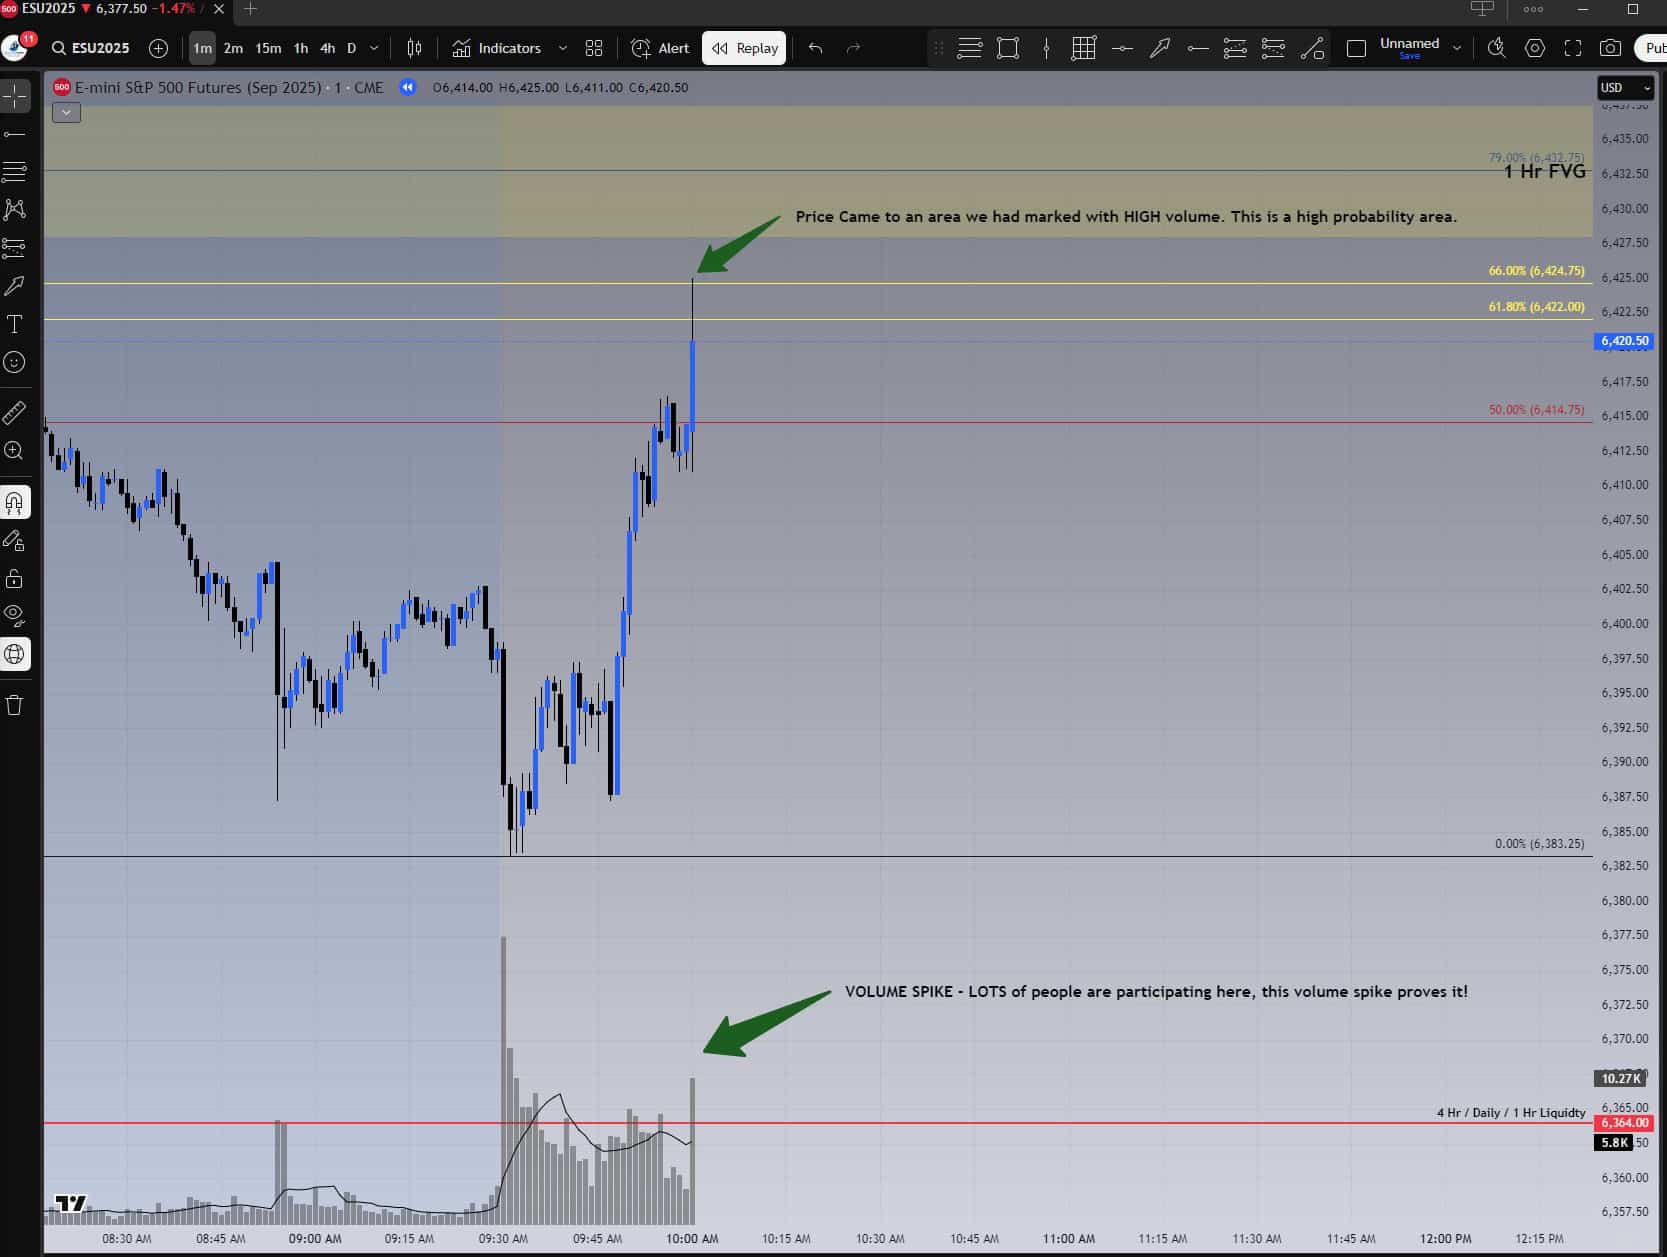
3) The 1-Minute Entry: golden pocket and volume spike
On the 1-minute chart, price tapped the golden pocket with heavy volume—almost to the tick. Many traders would assume this meant “price is going higher,” but this is where the edge comes in: we short into strength at predefined levels. The volume spike confirmed mass participation, exactly what we want to see at a high-probability entry.
4) Map the Trade: entry, stop, and risk
Now it’s time to define the trade in hard numbers. I marked the most recent swing low (entry, valid on a 1-minute close above) and the most recent swing high (stop). That gave 14 points of risk. On MES, at $5 per point, that equals $70 risk per contract. With risk defined before entry, I know exactly what’s at stake.
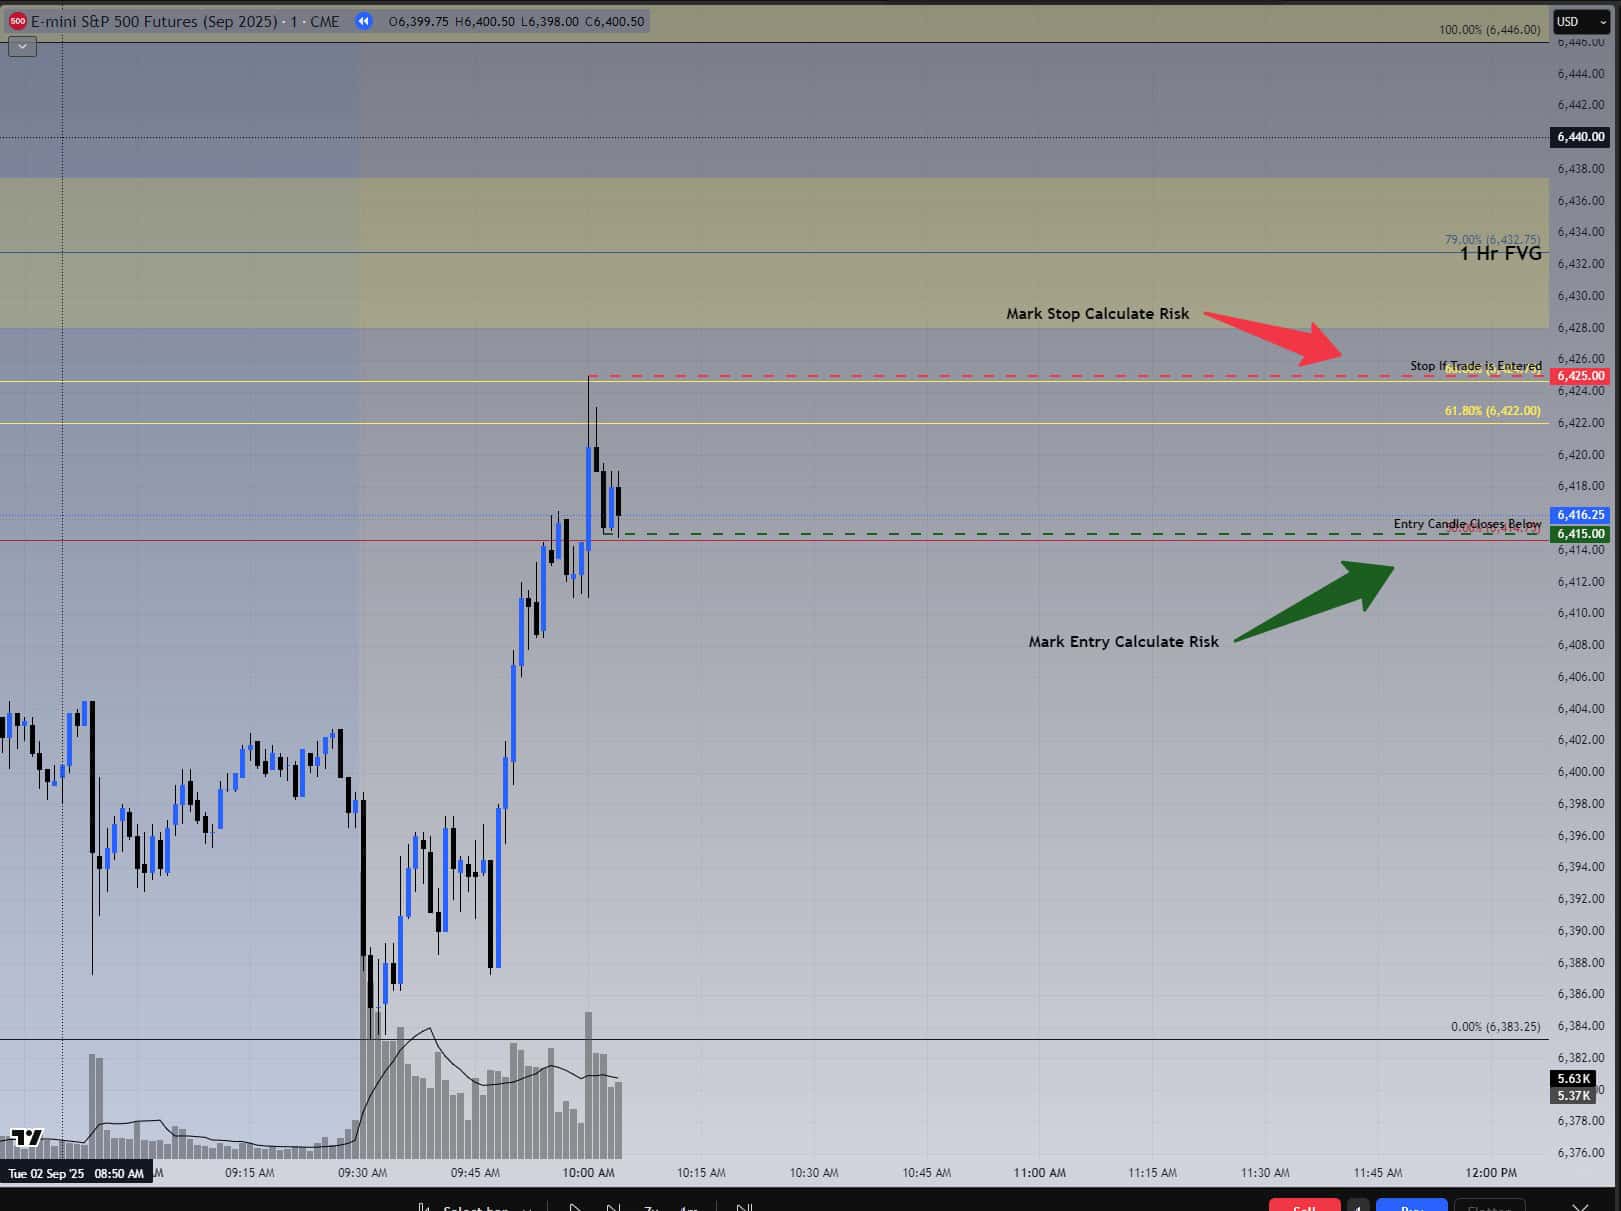
5) Market Improves the Risk
As price evolved, a new swing low formed. That let me tighten risk to an entry at 6415 and a stop at 6425—just 10 points, or $50 per MES. My daily max risk was $100, which meant I could take 2 contracts on this setup. On another day with tighter risk, I might size up; if risk is wider, I size down. Position size always follows risk.
6) Execution and Management: TP1, TP2, and R multiples
With the plan mapped, I executed as price triggered. TP1 and TP2 were both hit, locking in profit. TradingView measured the risk-to-reward to TP2 at 1:3.18. The final target may or may not hit, but that doesn’t matter—by TP2, the trade already met the plan’s objectives and booked a solid multiple.
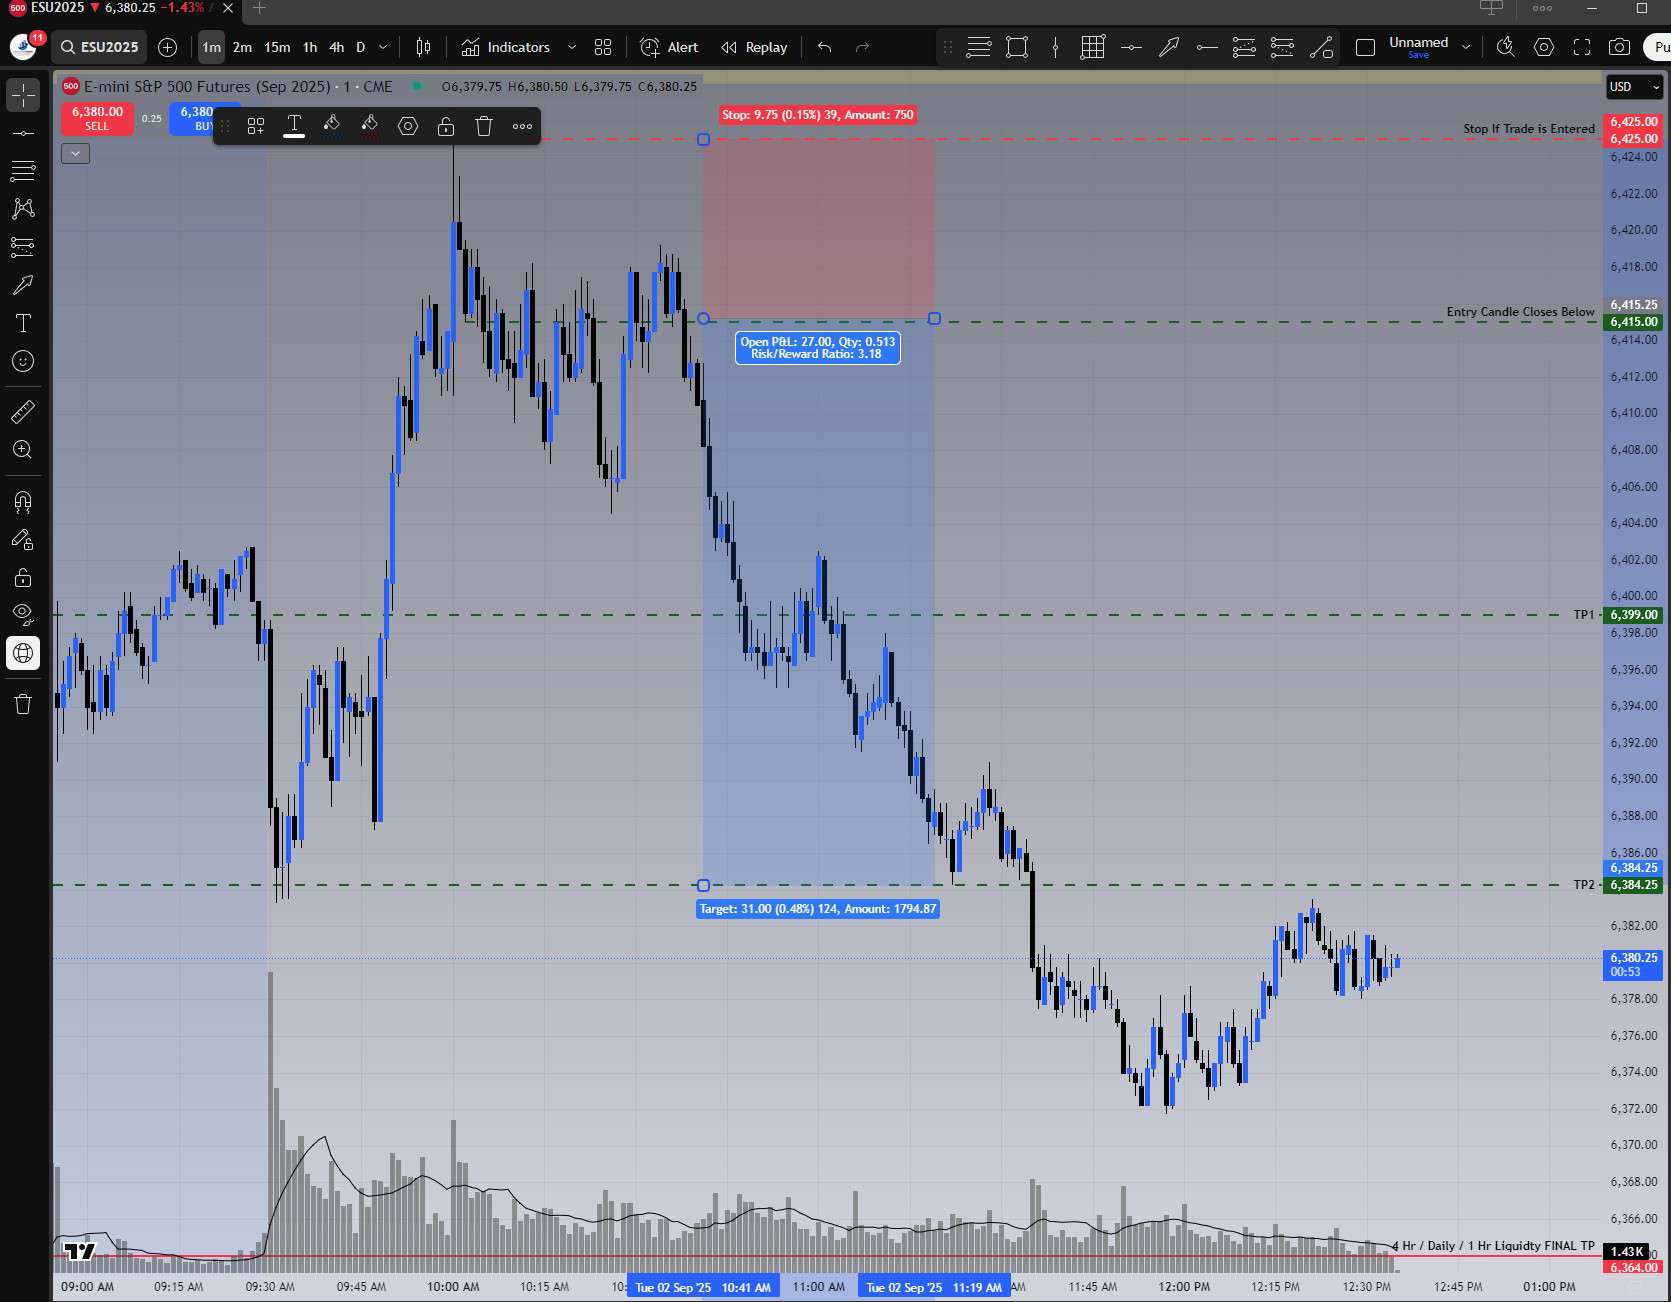
Quick math: Risk was $50 per contract, 2 contracts = $100 total risk. At 3.18R, the theoretical max was ~$318 gross per account. Scaling at TP1/TP2 changes realized numbers, but the process is identical. Some days, if risk allows, I can trade more contracts; other days, fewer. Always risk first.
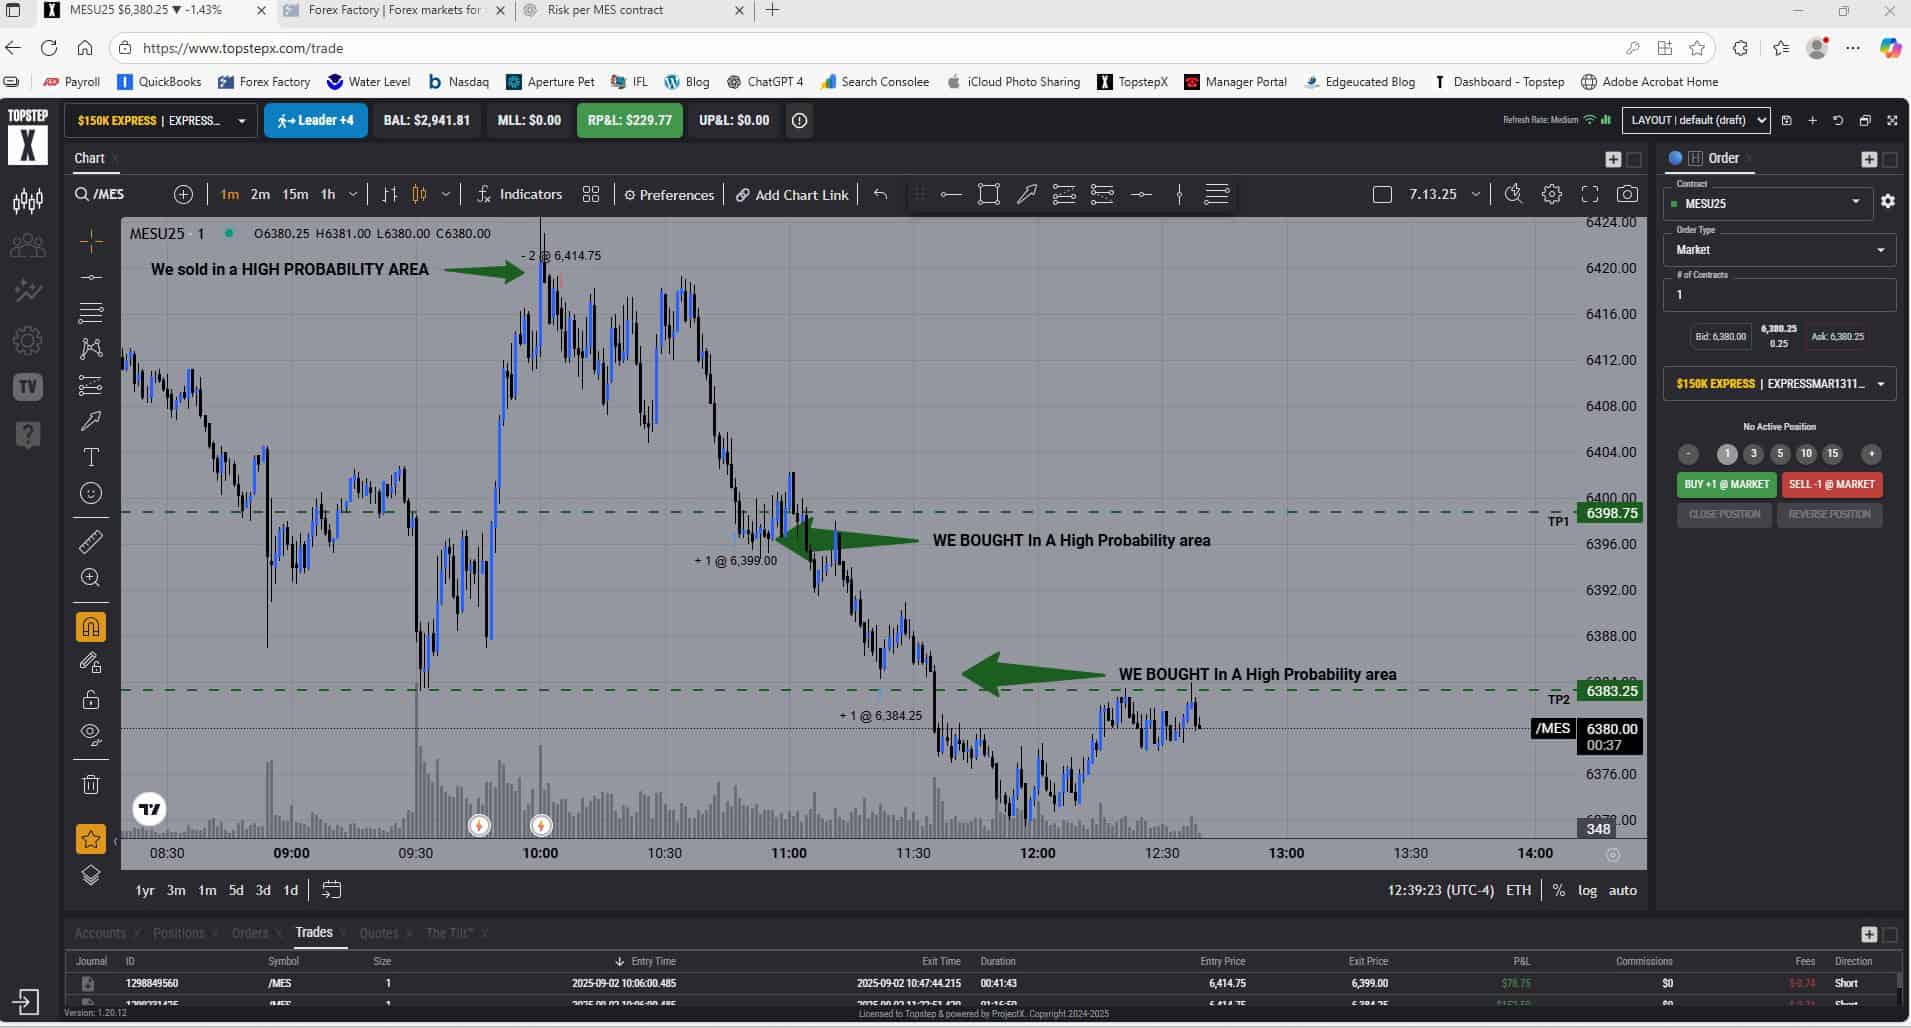
7) Realized Result (Live on Stream)
This wasn’t hindsight—it was streamed live in Discord. The TopStep account screen shows $229.77 profit on 2 contracts in one account. Multiply that across five copy-traded accounts, and the session ended with $1,148.85. Same trade, same rules, same risk discipline, applied consistently.
Reality Check: The Odds Are Stacked Against You
The odds are not in your favor. You probably have a better chance of walking out of a Vegas casino ahead than becoming a long-term profitable prop-firm trader. If you treat trading like a lottery, trading is not for you.
Why I still trade: I don’t bet—I measure:
- Trade only where others are active (volume confirms).
- Map risk before entry (entry/stop defined by structure).
- Tighten the map as the market evolves.
- Cap daily loss and size from the cap, never feelings.
- Scale at pre-planned targets (TP1/TP2).
That’s how you survive in a game where most blow up.
The Repeatable Process (Clipboard Version)
- Mark the area you want to trade (FVGs, liquidity, golden pocket).
- Wait for volume—let the market prove participation.
- Map the trade: entry, stop, and risk in points × $5 per MES.
- Set a daily risk cap and back-solve position size. Sometimes that’s 2 micros, sometimes more, sometimes less.
- Adjust when new swings form.
- Execute the plan and scale at TP1/TP2.
- Log it: screenshots, R multiple, fills, notes.
Takeaway
- Not luck: Location + participation + structure.
- Risk first: Know the loss before the trade.
- Consistency wins: Size changes, process does not.
If you enjoy this content, please remember it takes a lot of time to put together.
Show your support by giving it a like and share on X so I know you appreciate it.
All of this is 100% free!