
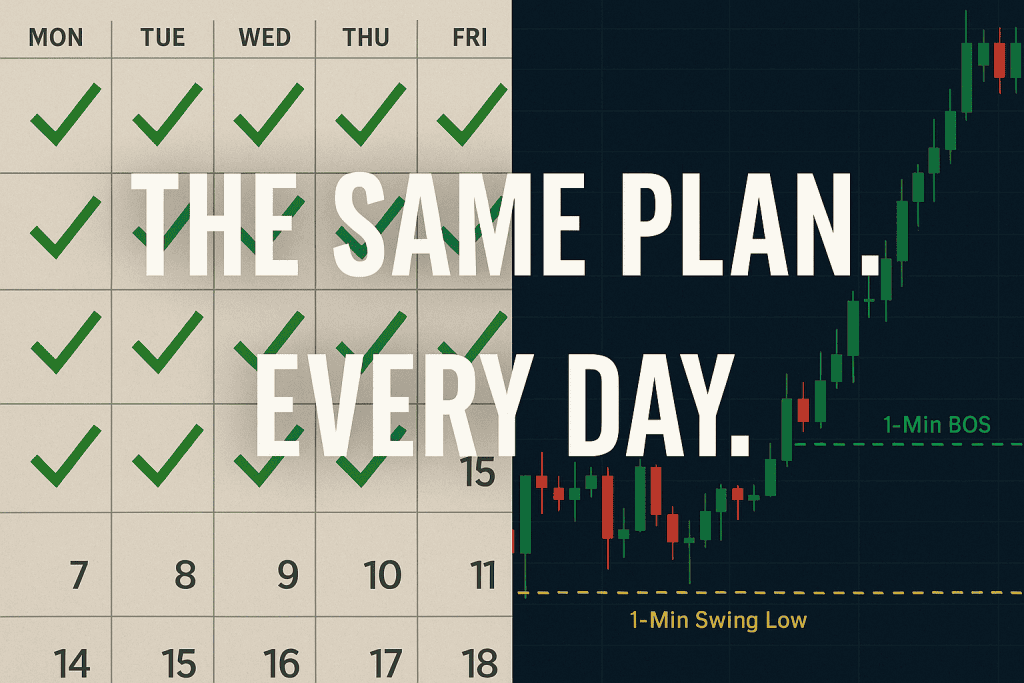
Every day, we follow the exact same process. It’s not magic, it’s discipline. The only way to become a consistently profitable trader is to execute the same plan every single day, refining your edge as market conditions change. August 11, 2025, was another textbook example of sticking to the process.
Step 1: Identifying Liquidity Levels at the Open
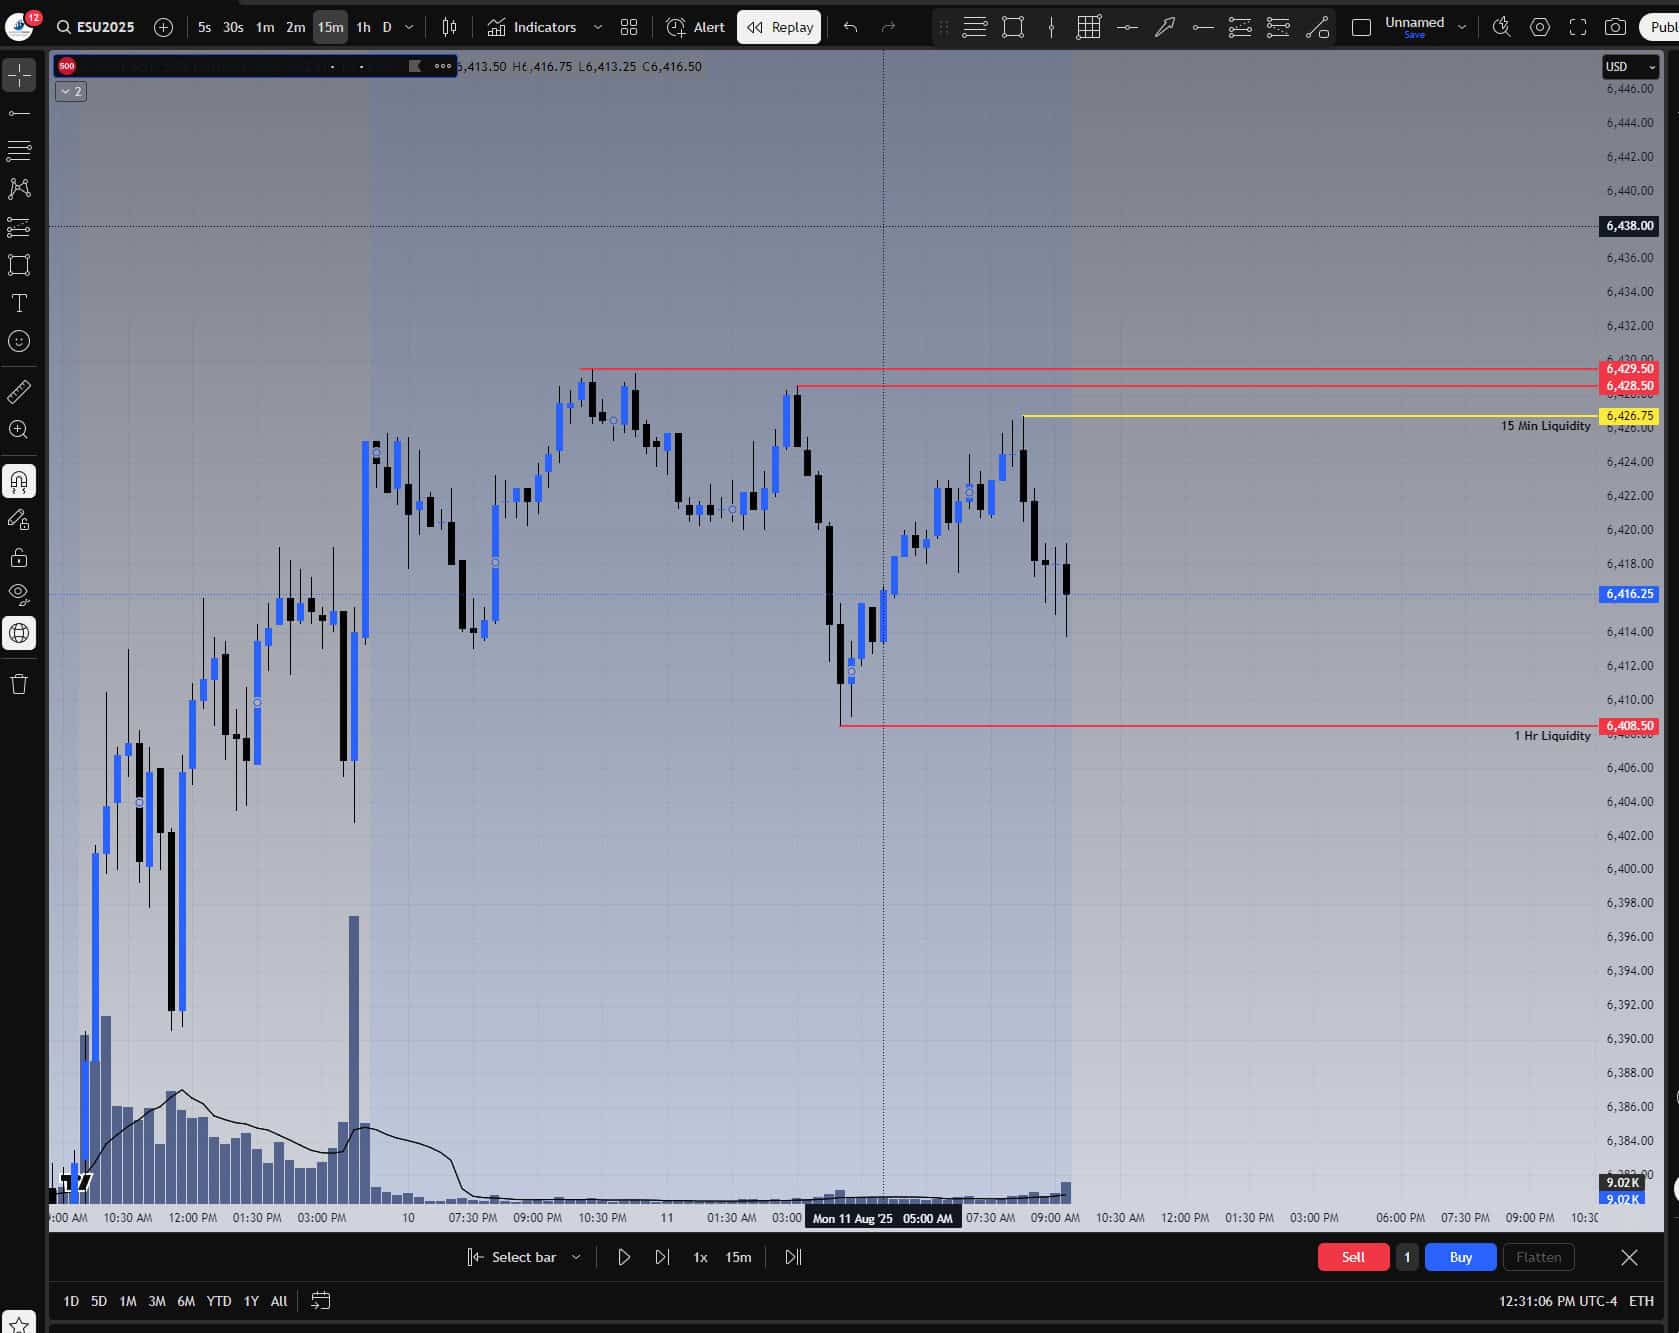
At the 9:30 AM EST opening bell, our 15-minute ES chart was already mapped out with key liquidity levels — one-hour liquidity zones marked in red and 15-minute liquidity zones in yellow. These zones give us our bias and our areas of interest before a single trade is taken.
Step 2: Price Moves Into Our Area of Interest
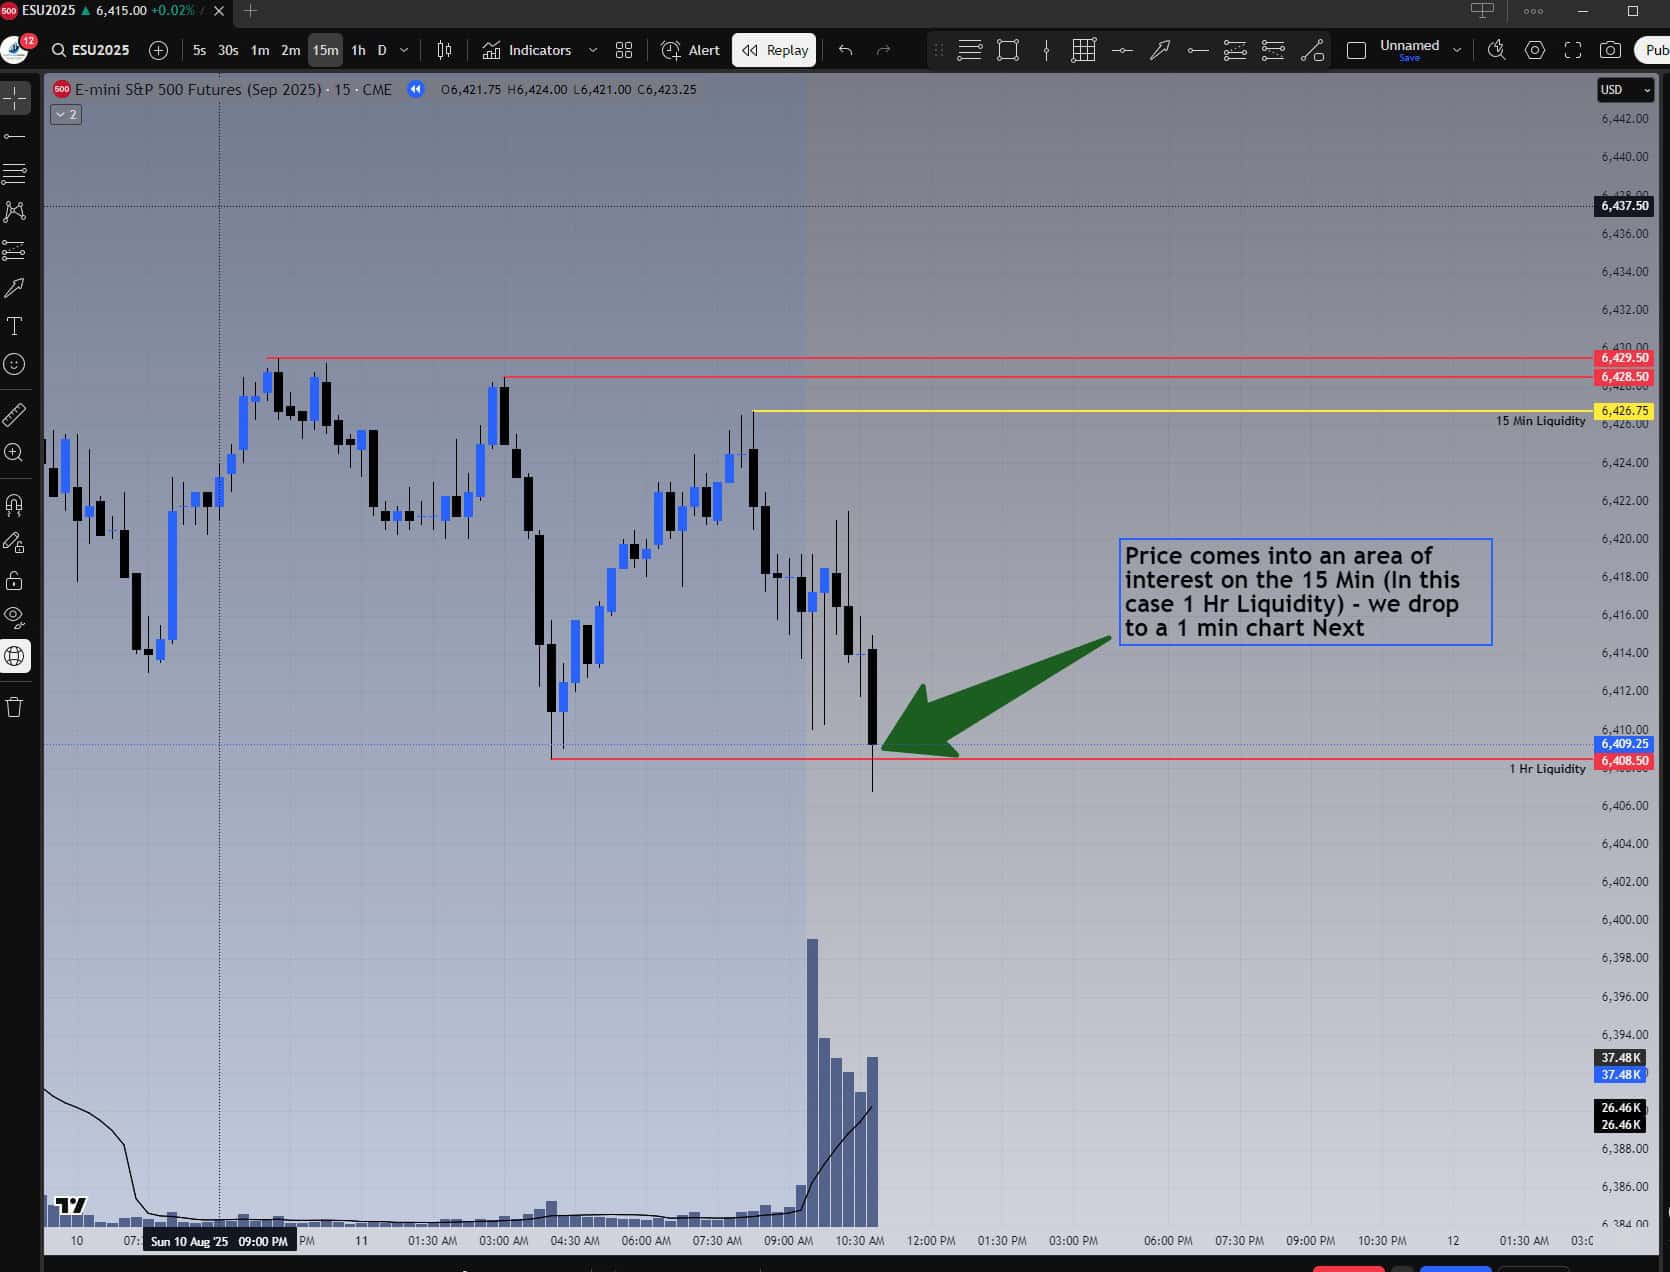
By around 10:45 AM EST, price came down into our one-hour liquidity area at 6408.50. This is where we drop to a one-minute chart to look for entry conditions. Having the higher timeframe context already mapped allows us to act decisively when price gets here.
Step 3: Spotting the Volume Spike
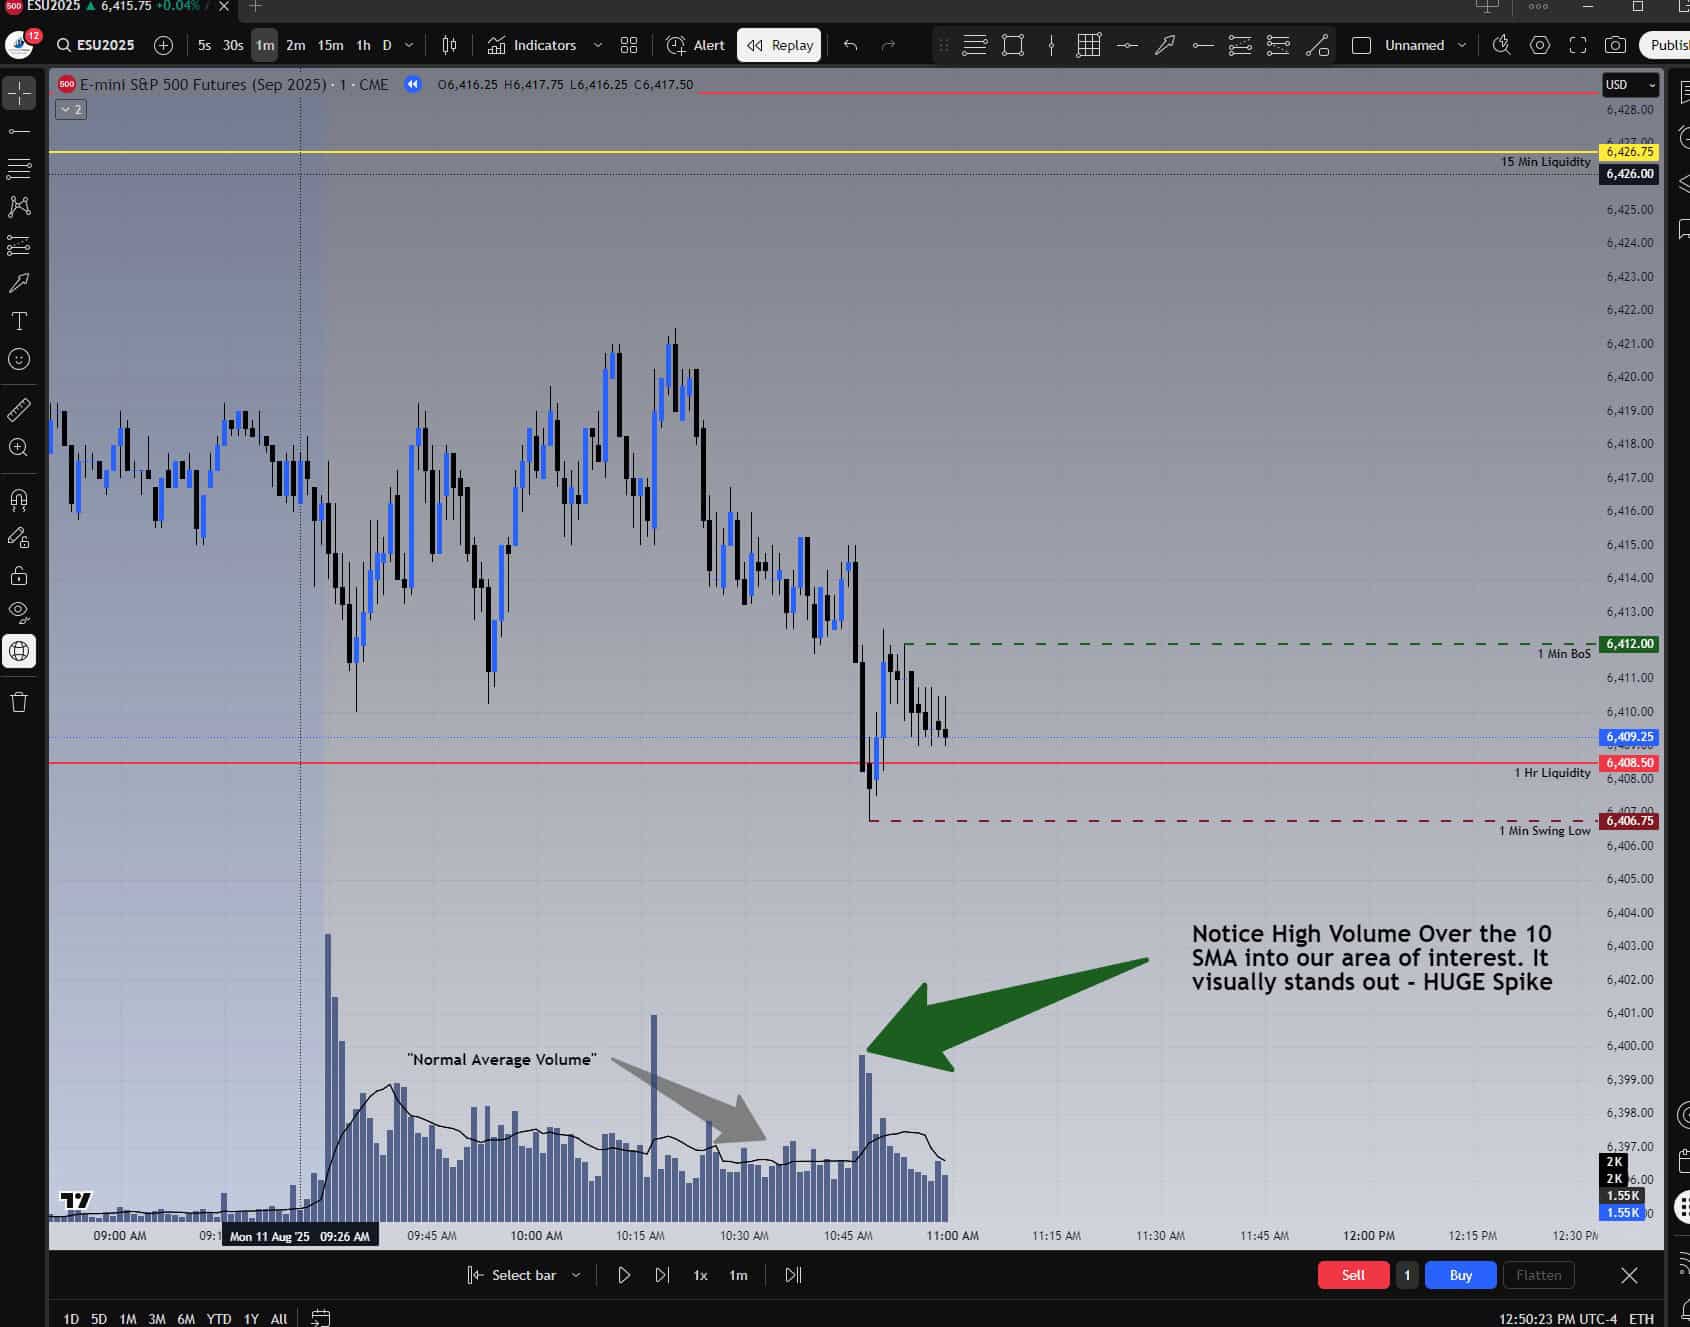
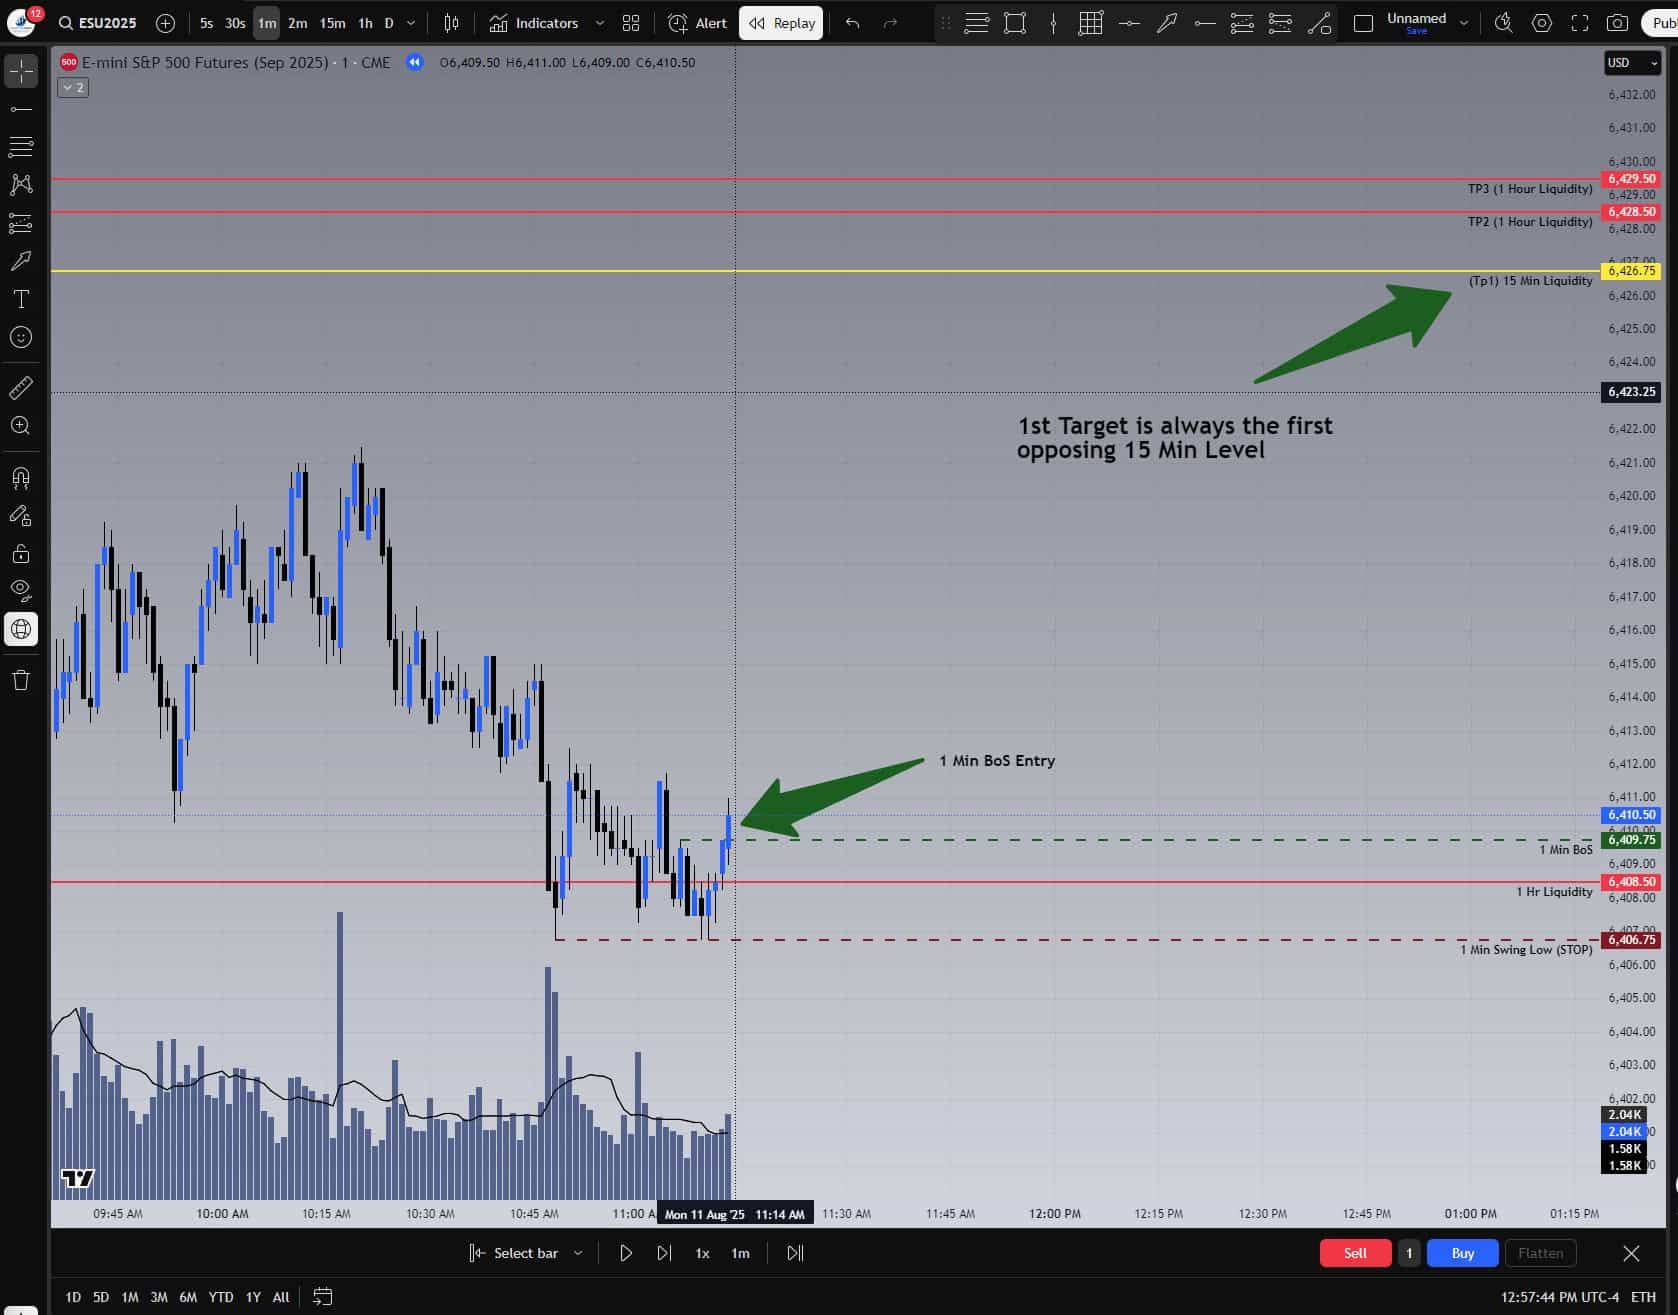
On the one-minute chart, we saw exactly what we want — a huge volume spike well above the 10 SMA, right in our area of interest. This is our signal to prepare for a potential break of structure (BOS) entry. We marked the one-minute swing low, the BOS level, and calculated our risk for either ES or MES contracts. From here, all that’s left is to patiently wait.
Step 4: Break of Structure and Trade Execution
At 11:13 AM EST, we got our one-minute break of structure. By this time, all profit targets were already mapped out on the 15-minute chart — TP1, TP2, and TP3. The first target is always the first opposing 15-minute level. Risk was defined, stop was in place, and there was nothing left to do but let the trade play out.
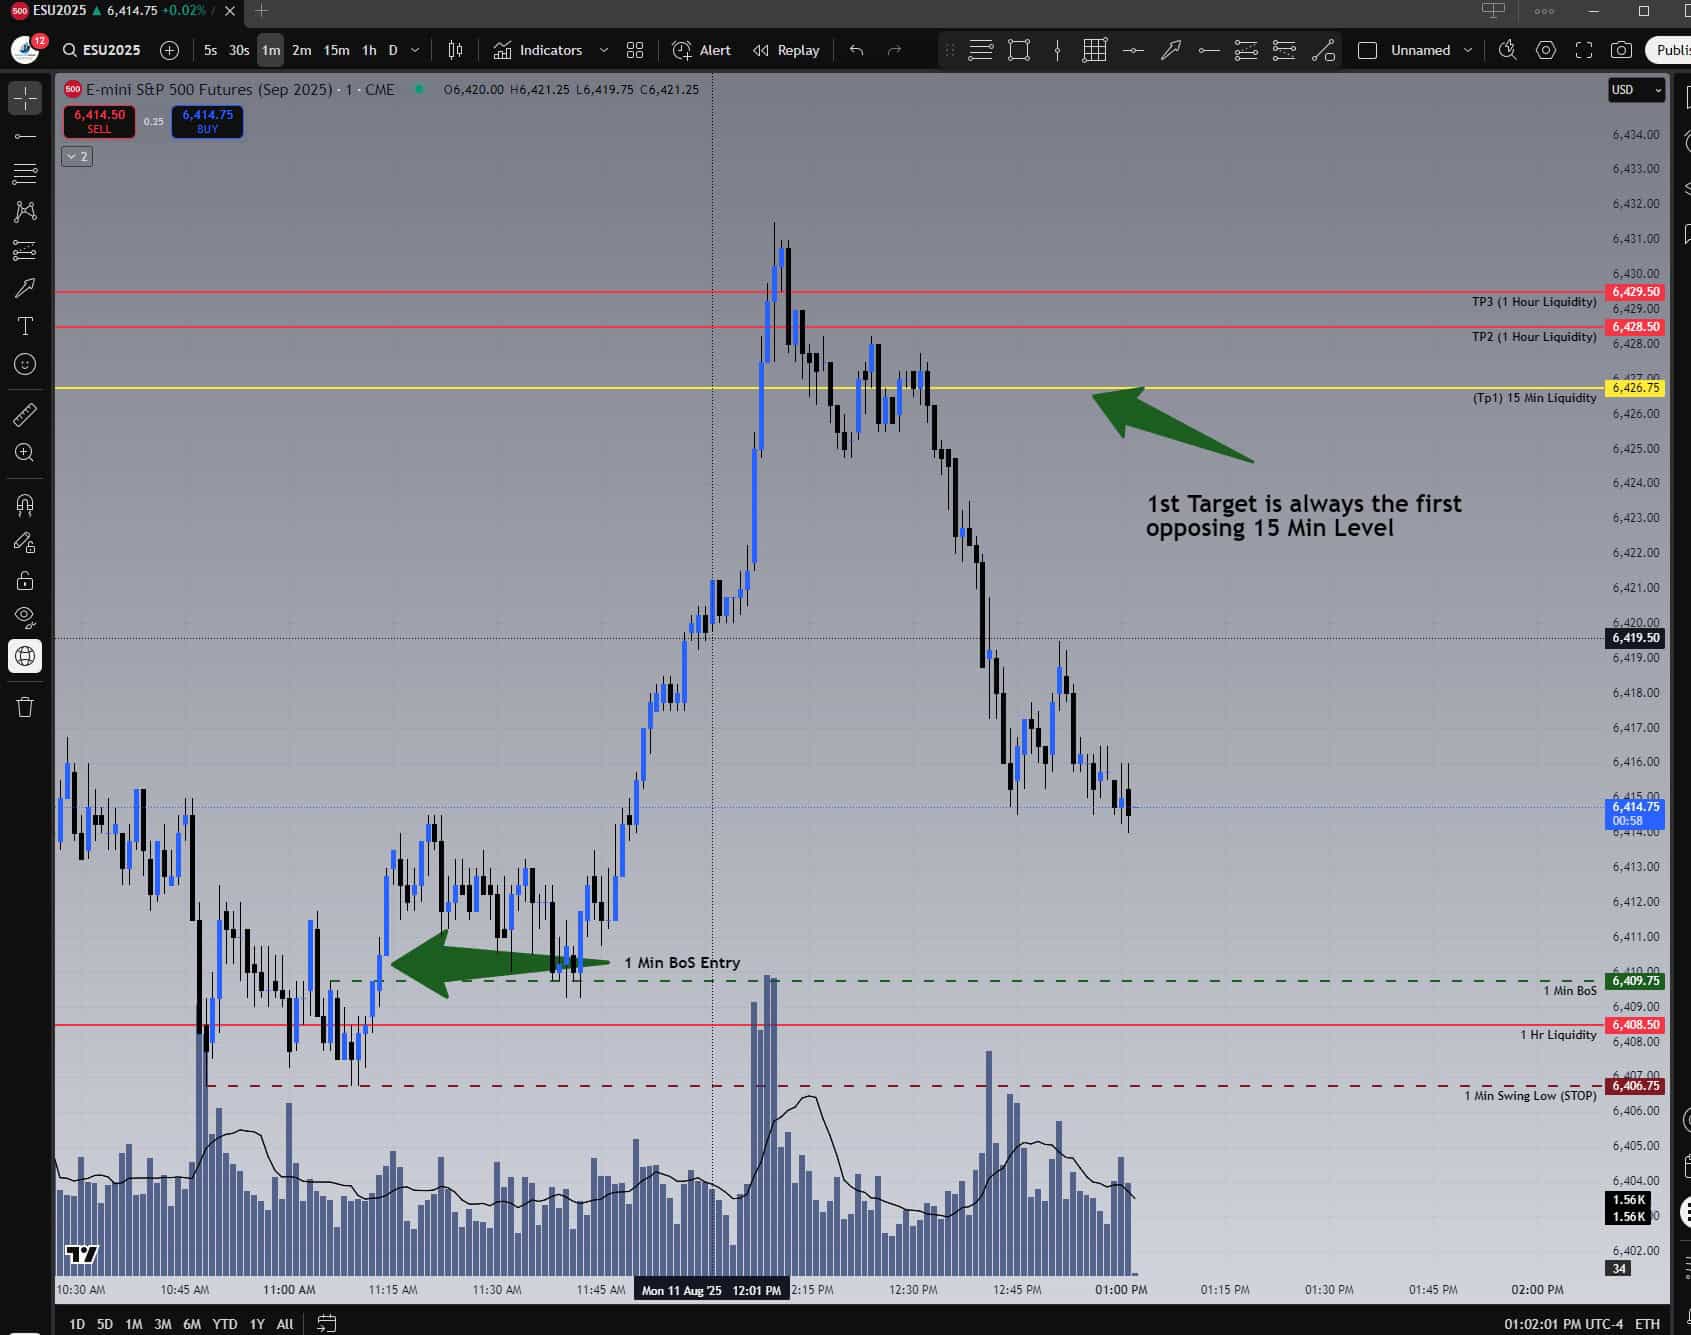
Step 5: Targets Achieved
All three targets were hit before the market reversed. With two contracts, we took profits at TP1 and TP2. Once the plan is executed, we’re done for the day — no chasing, no revenge trading. The market reversing after TP3 doesn’t matter. Our job is to capture the move and step away.
Step 6: Proof of Execution
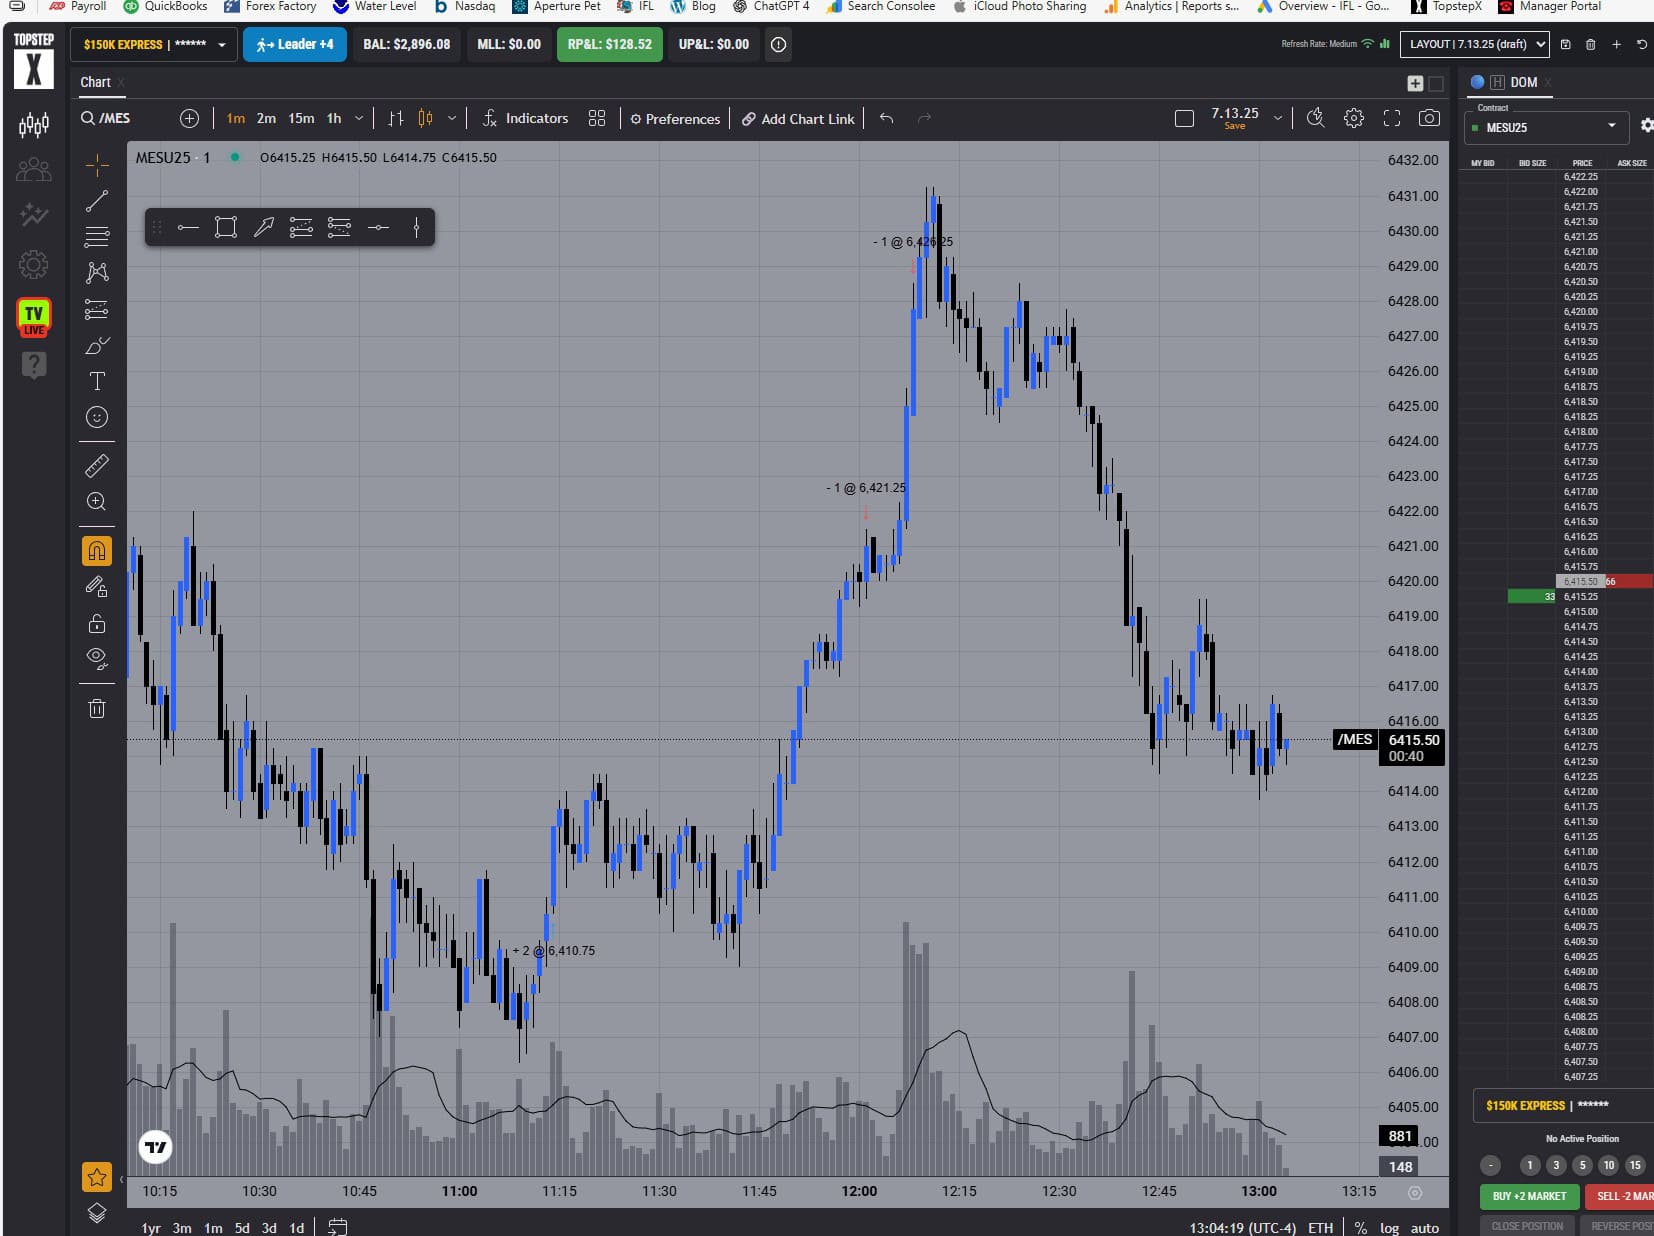
Our TopStep account confirms the trade exactly as shown on the charts — two MES contracts, TP1 and TP2 hit, then a reversal. This is clear proof that we’re trading in high-probability areas where the market is likely to turn. The $128.52 profit on two micros may not seem massive on its own, but across all five TopStep accounts that’s $642.60 — achieved while trading two micros with small, controlled risk. For perspective, the same move with two full-size ES contracts would have been $1,285.20 per account, or $6,426.00 across all five accounts.
The Takeaway
Consistency comes from doing the same thing every day — identifying your zones, waiting for confirmation, managing risk, and letting the trade work. Market conditions will change, but if you continually refine your edge while sticking to your process, you put yourself in the best position to win over the long term.
Enjoyed this trade recap? Follow us on X (Twitter) for daily insights and real-time updates, and please share this post with your friends if you found it helpful. Your support helps us keep delivering quality trading content!