
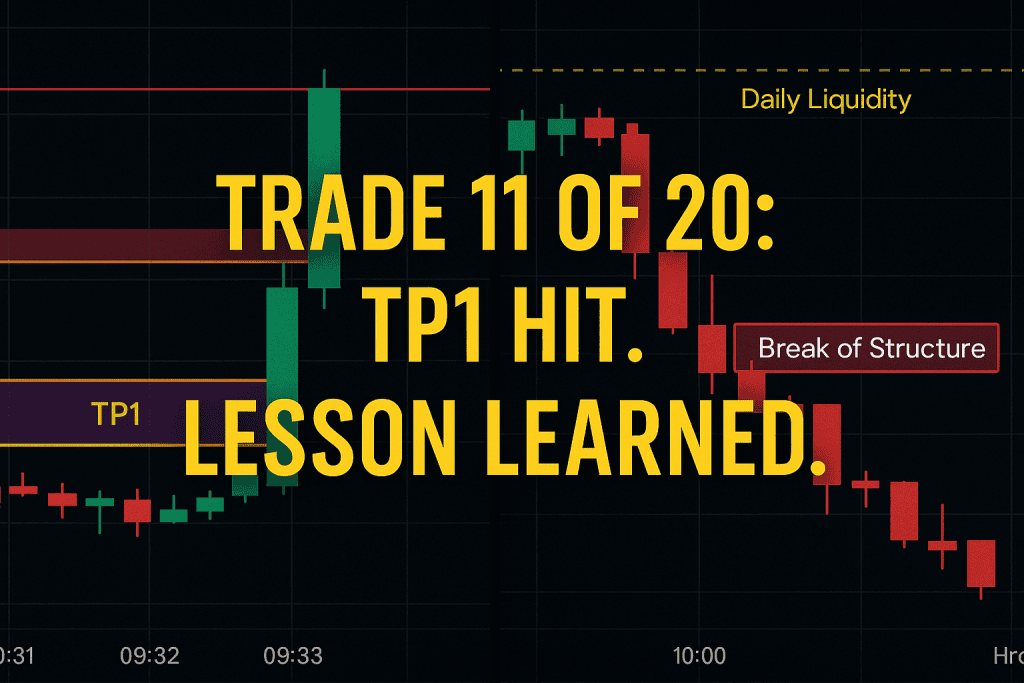
We’re now officially 11 trades deep into the BoS Sniper Strategy challenge. The scorecard reads: 5 wins, 5 losses, and 1 breakeven.
Today’s trade was a textbook winner. But more importantly — it was a teacher. Because as I reviewed everything afterward, I noticed something I didn’t see before the open. And that’s what this challenge is all about: repeating the same setup with discipline, tracking outcomes, and using that data to evolve into a better trader.
🔍 The Pre-Market Prep
As always, we started the day with our structured S&P 500 markup. This chart is from 9:00 AM EST, before the cash session began. Everything was marked out and color-coded like we do every single day:
- Red lines = previous day high/low or 1-hour liquidity
- Yellow lines = 15-minute liquidity sweeps
- Purple boxes = 15-minute fair value gaps (FVGs)
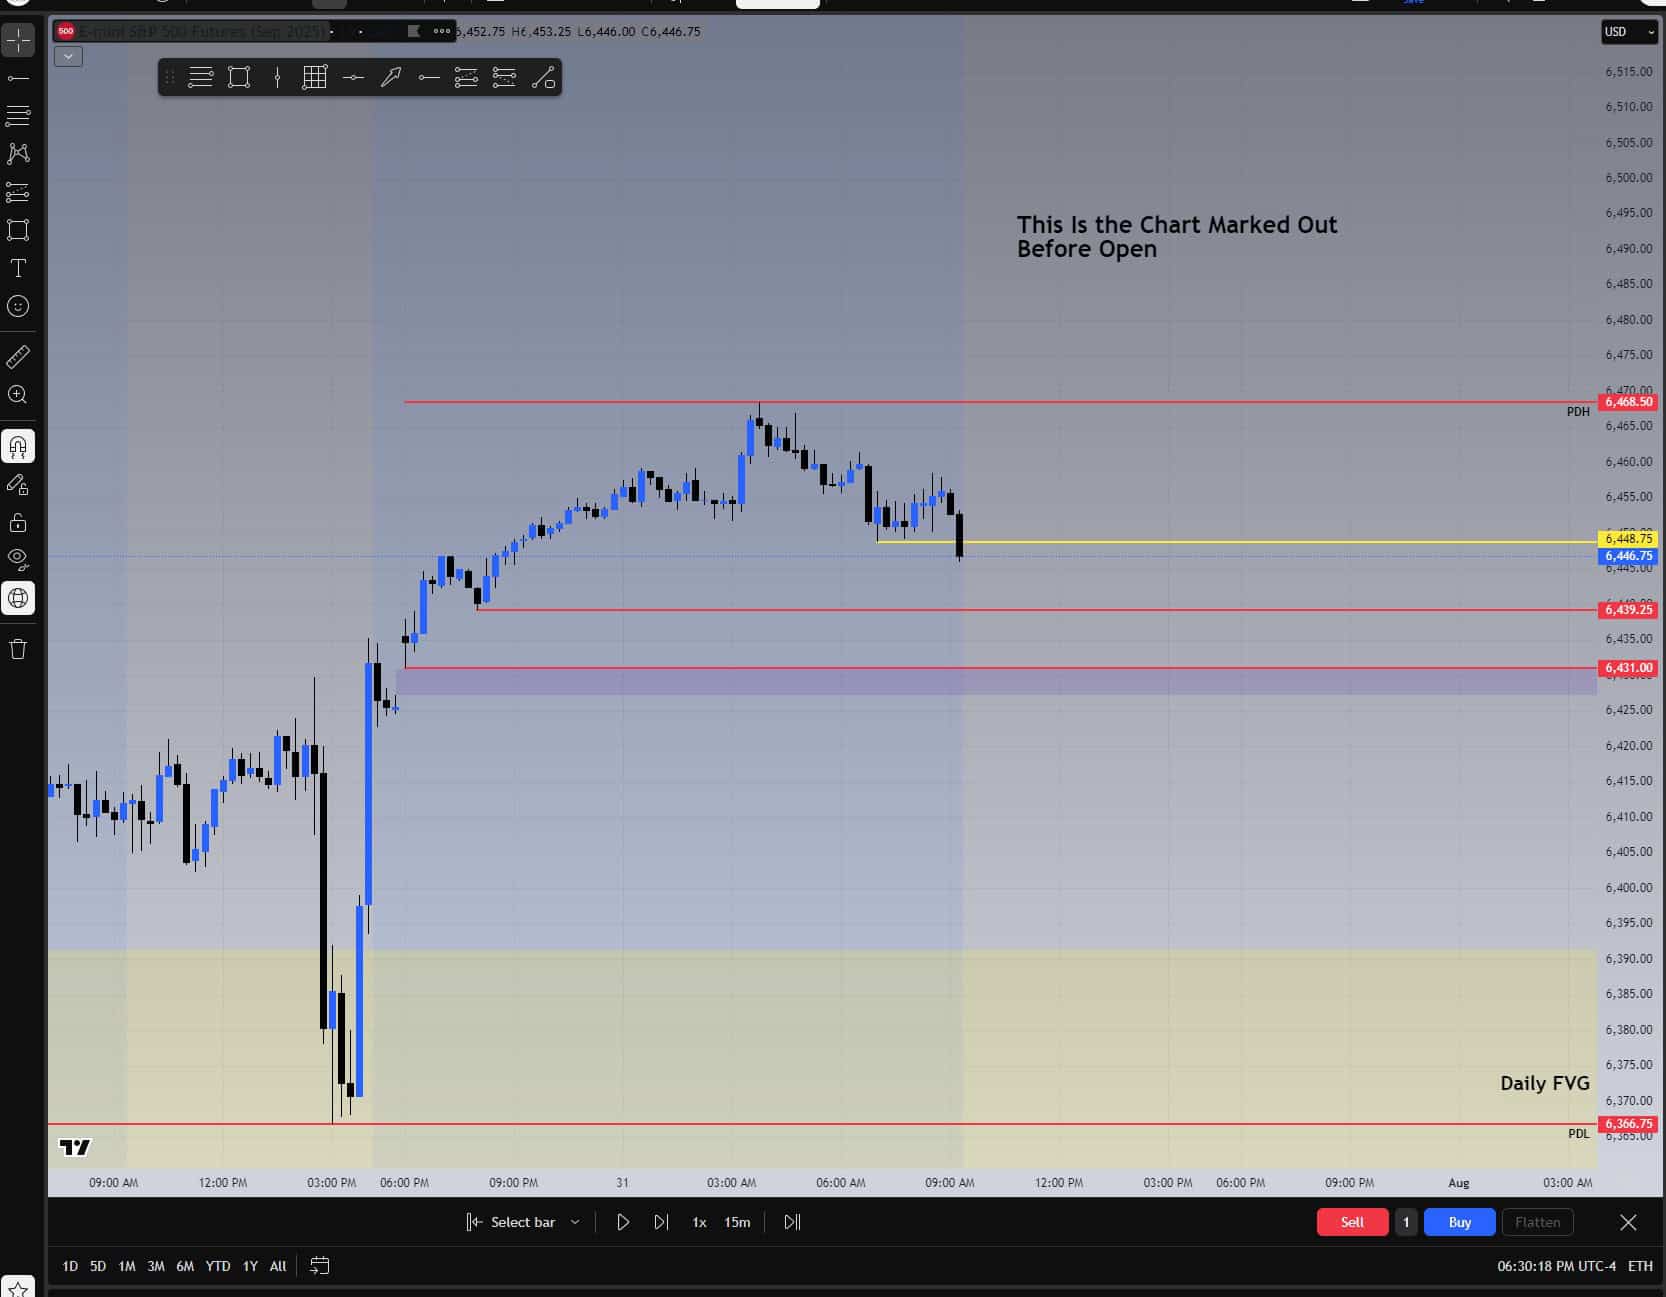
S&P 500 pre-market markup at 9:00 AM — red = previous day highs/lows, yellow = 15-min liquidity, purple = 15-min FVGs.
📉 Price Comes Into Our Area of Interest
Shortly after the open, ES dropped right into a purple box (15-min FVG) and crossed one of the red lines representing 1-hour liquidity. This is what we wait for. A deep move into a pre-defined zone, confirmed by a volume spike above the 10 SMA.
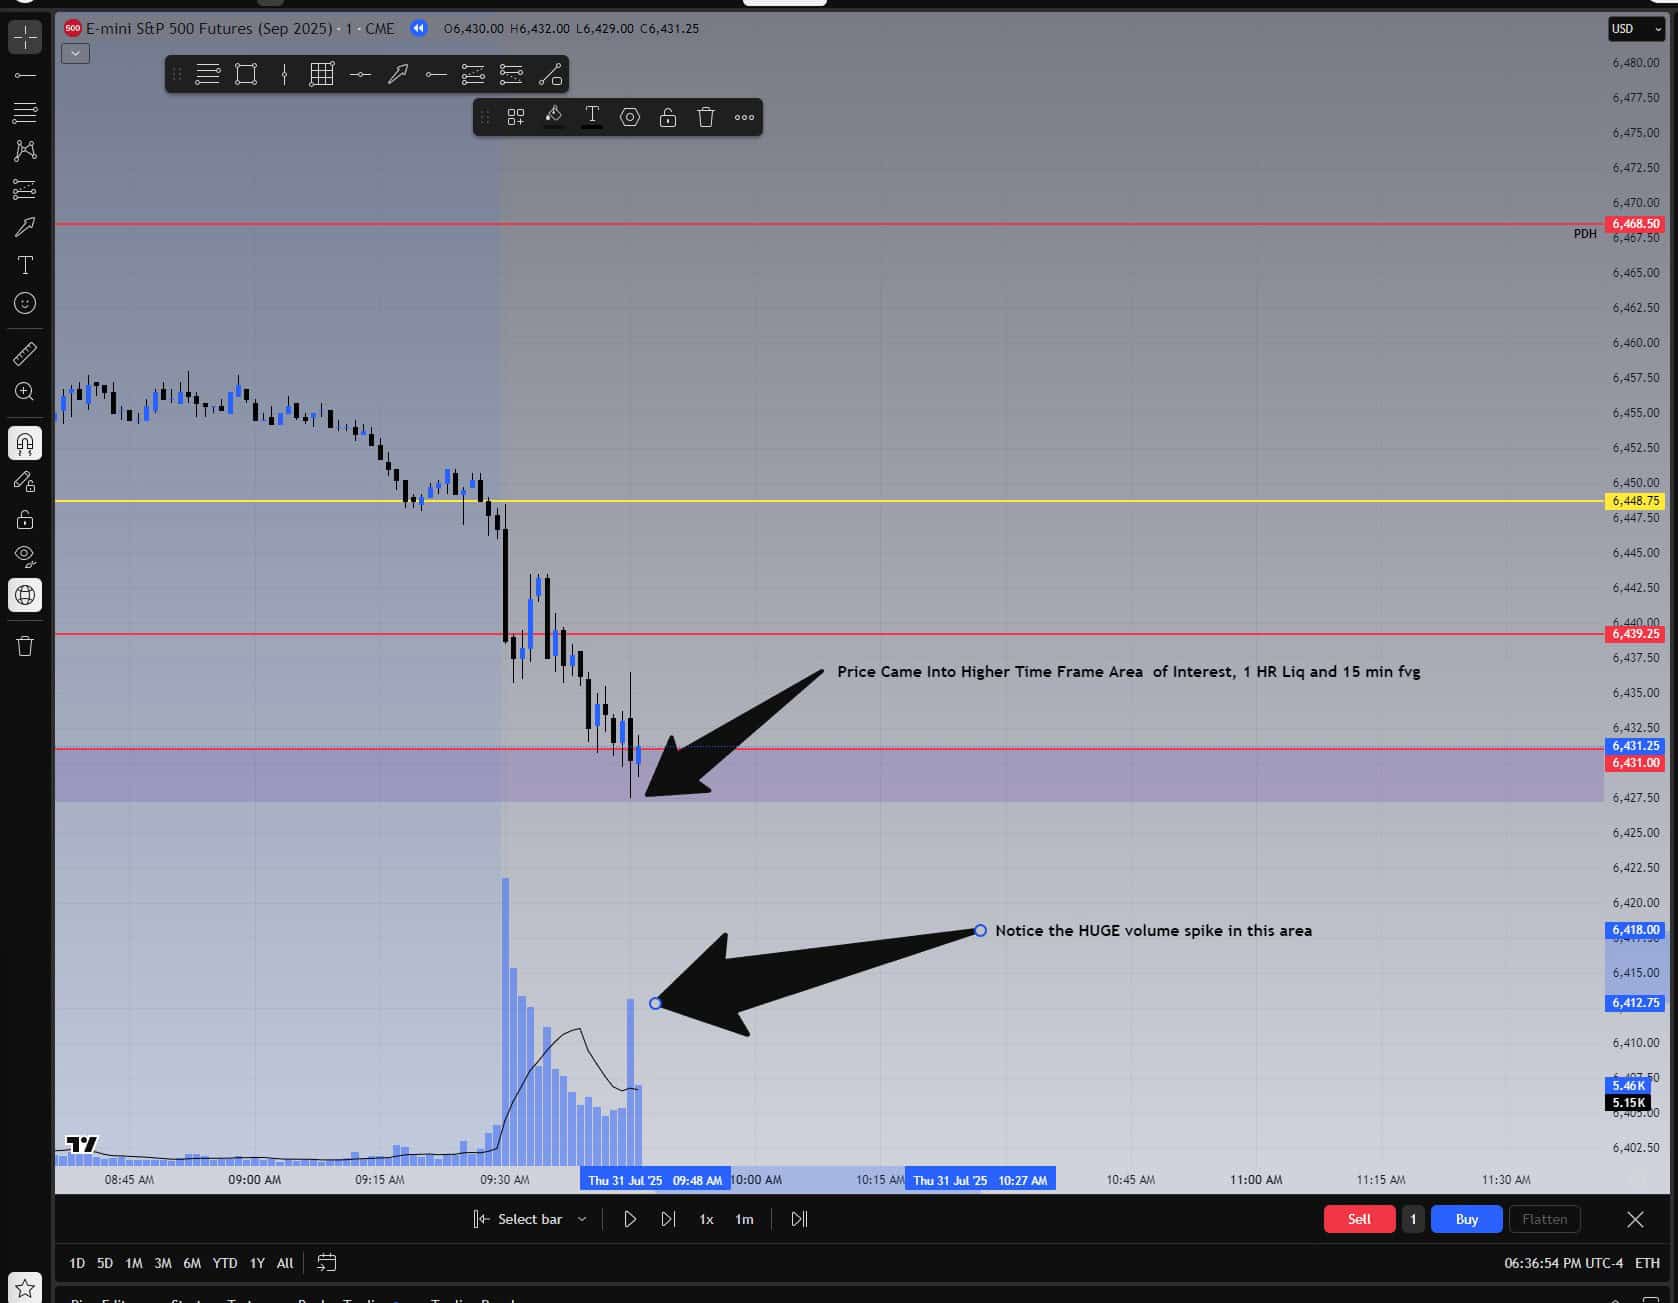
1-minute chart of ES as price tags pre-marked liquidity and FVG levels — volume explodes above the 10 SMA, signaling high interest from large players.
🎯 Entry Confirmed: 1-Minute BoS
As soon as the 1-minute BoS (Break of Structure) confirmed, we were in. No hesitation. The volume was there, the structure was there, the prep was done. Risk was calculated based on the stop distance — in this case, 3 ES contracts gave us $150 of risk per account, or $750 total across 5 TopStep accounts.
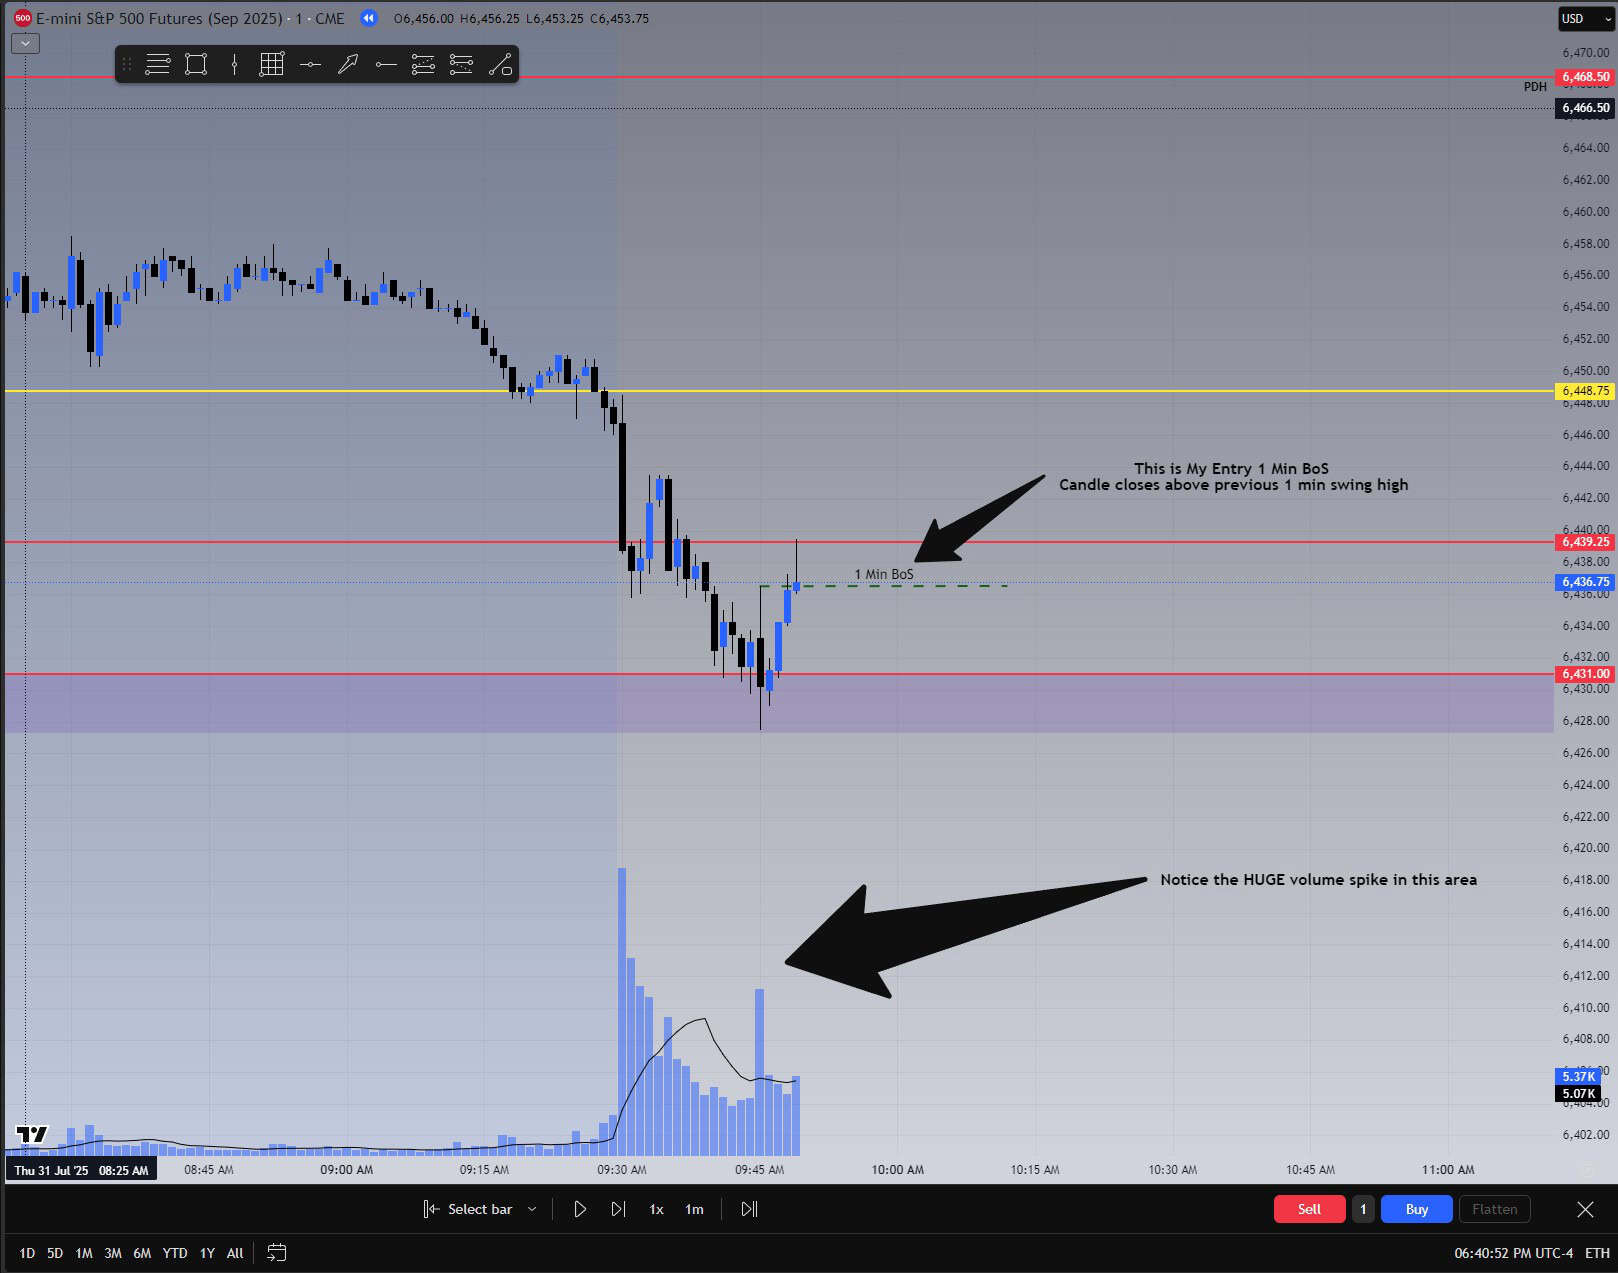
Confirmed 1-minute BoS — entry is executed using 3 ES contracts with total risk spread across five funded accounts. No hesitation.
✅ TP1 Hit – Stop to Breakeven
Price moved straight into our first target — the bottom of opposing 15-minute liquidity. At that moment, TP1 was secured, and stop-loss was moved to breakeven on the remaining two contracts.
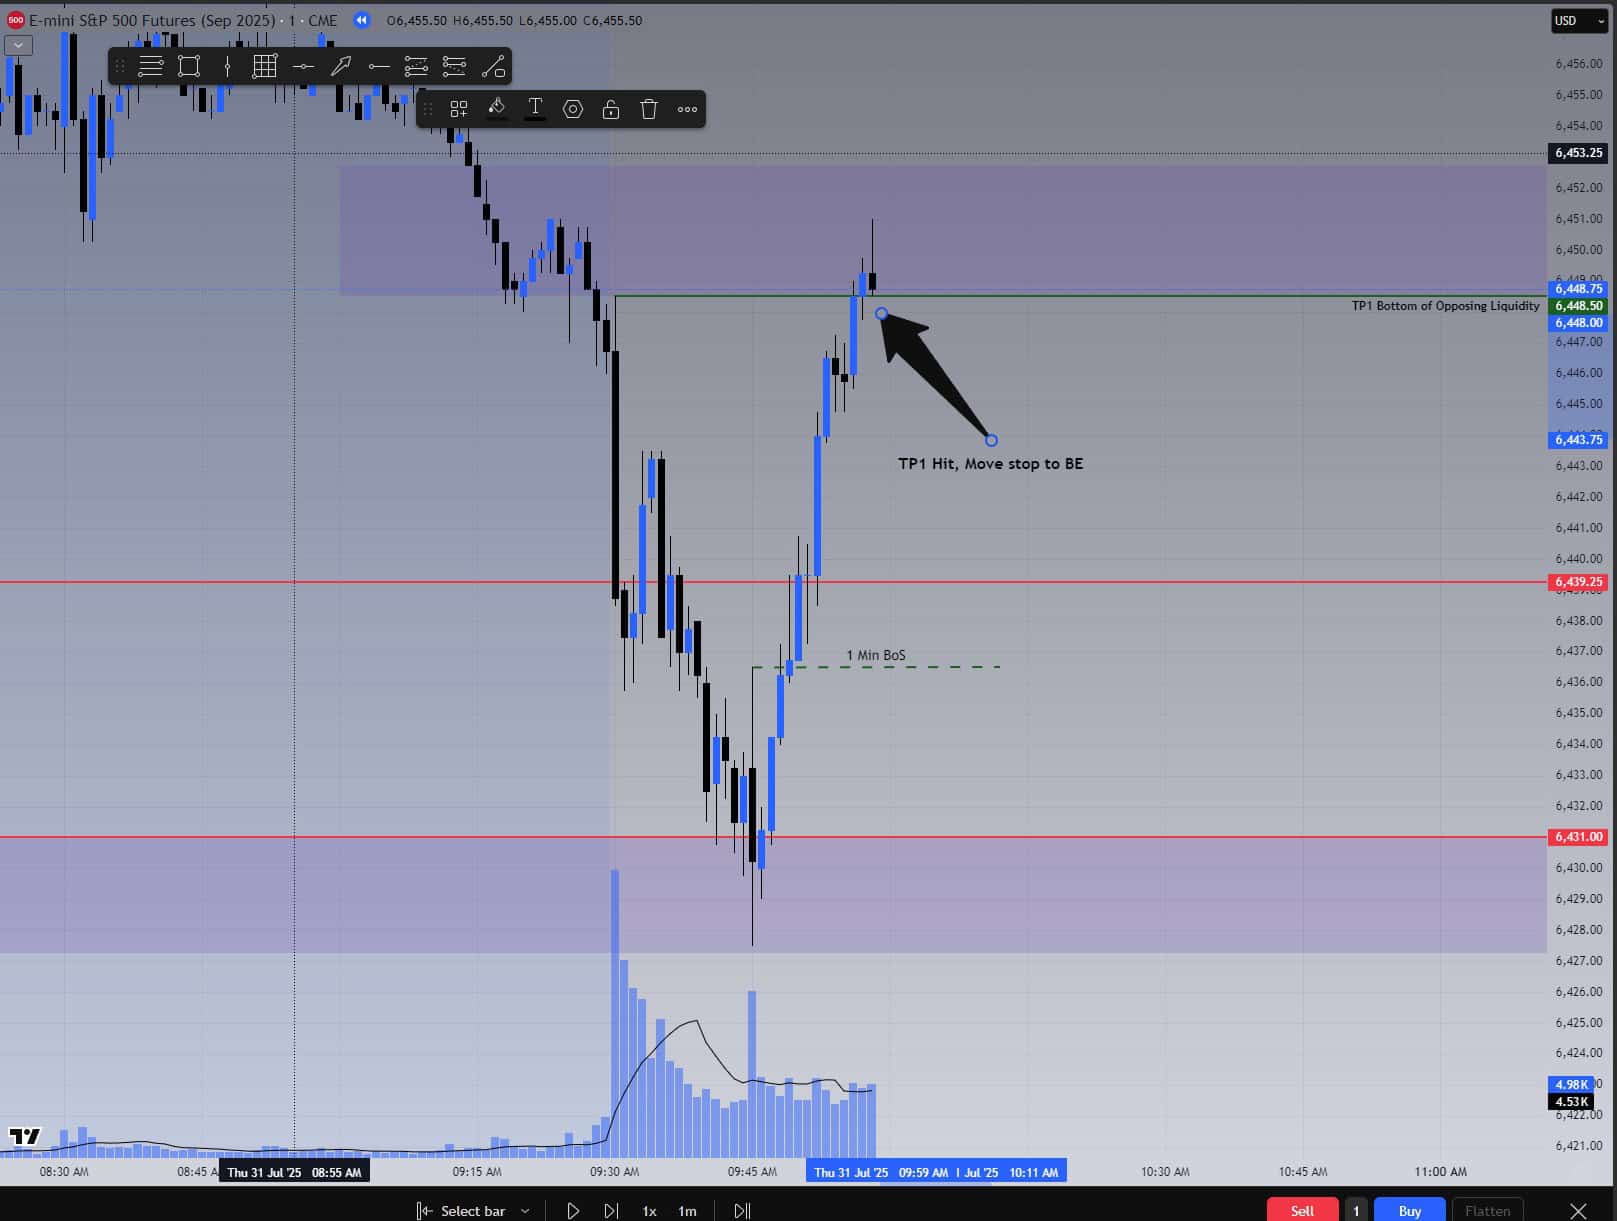
TP1 reached cleanly at 15-minute liquidity. Stop moved to breakeven. Setup executed to perfection.
📊 TopStep Execution – Proof of Discipline
Here’s the TopStep trade confirmation. Three contracts were entered. One was taken off at TP1. The remaining two were stopped out at breakeven. This is the system working exactly as designed.
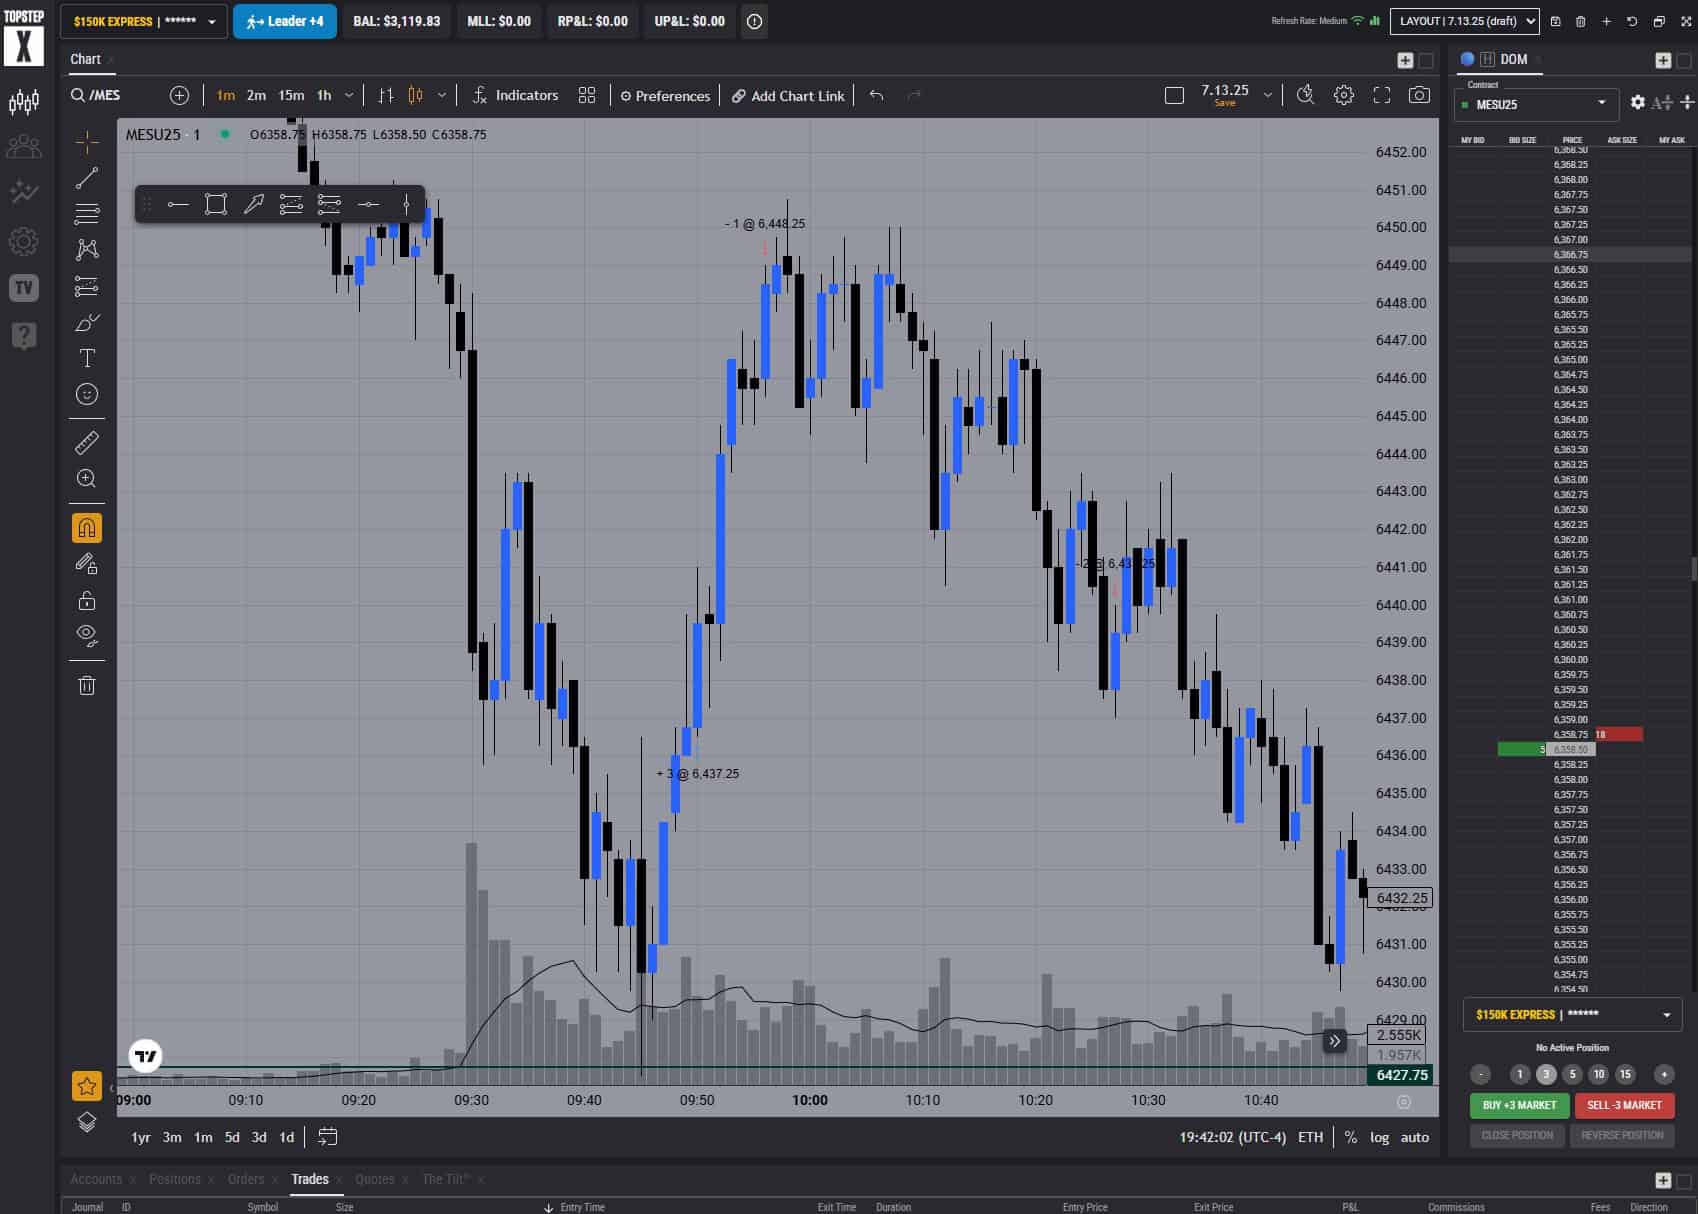
TopStep execution confirms real trade: 3 ES contracts — one closed at TP1, two stopped out at breakeven. Strategy executed precisely as planned.
🧠 The Bias Review – What I Missed
This trade was a win. But afterward, I noticed something I didn’t have marked before the open — and it matters.
On the 1-hour chart, price had already swept daily liquidity overnight and was forming a bearish structure flip during the 9–10 AM candle. That candle ended up closing as a break of structure to the downside. My initial bias was bullish — but in hindsight, the higher timeframe was starting to shift.
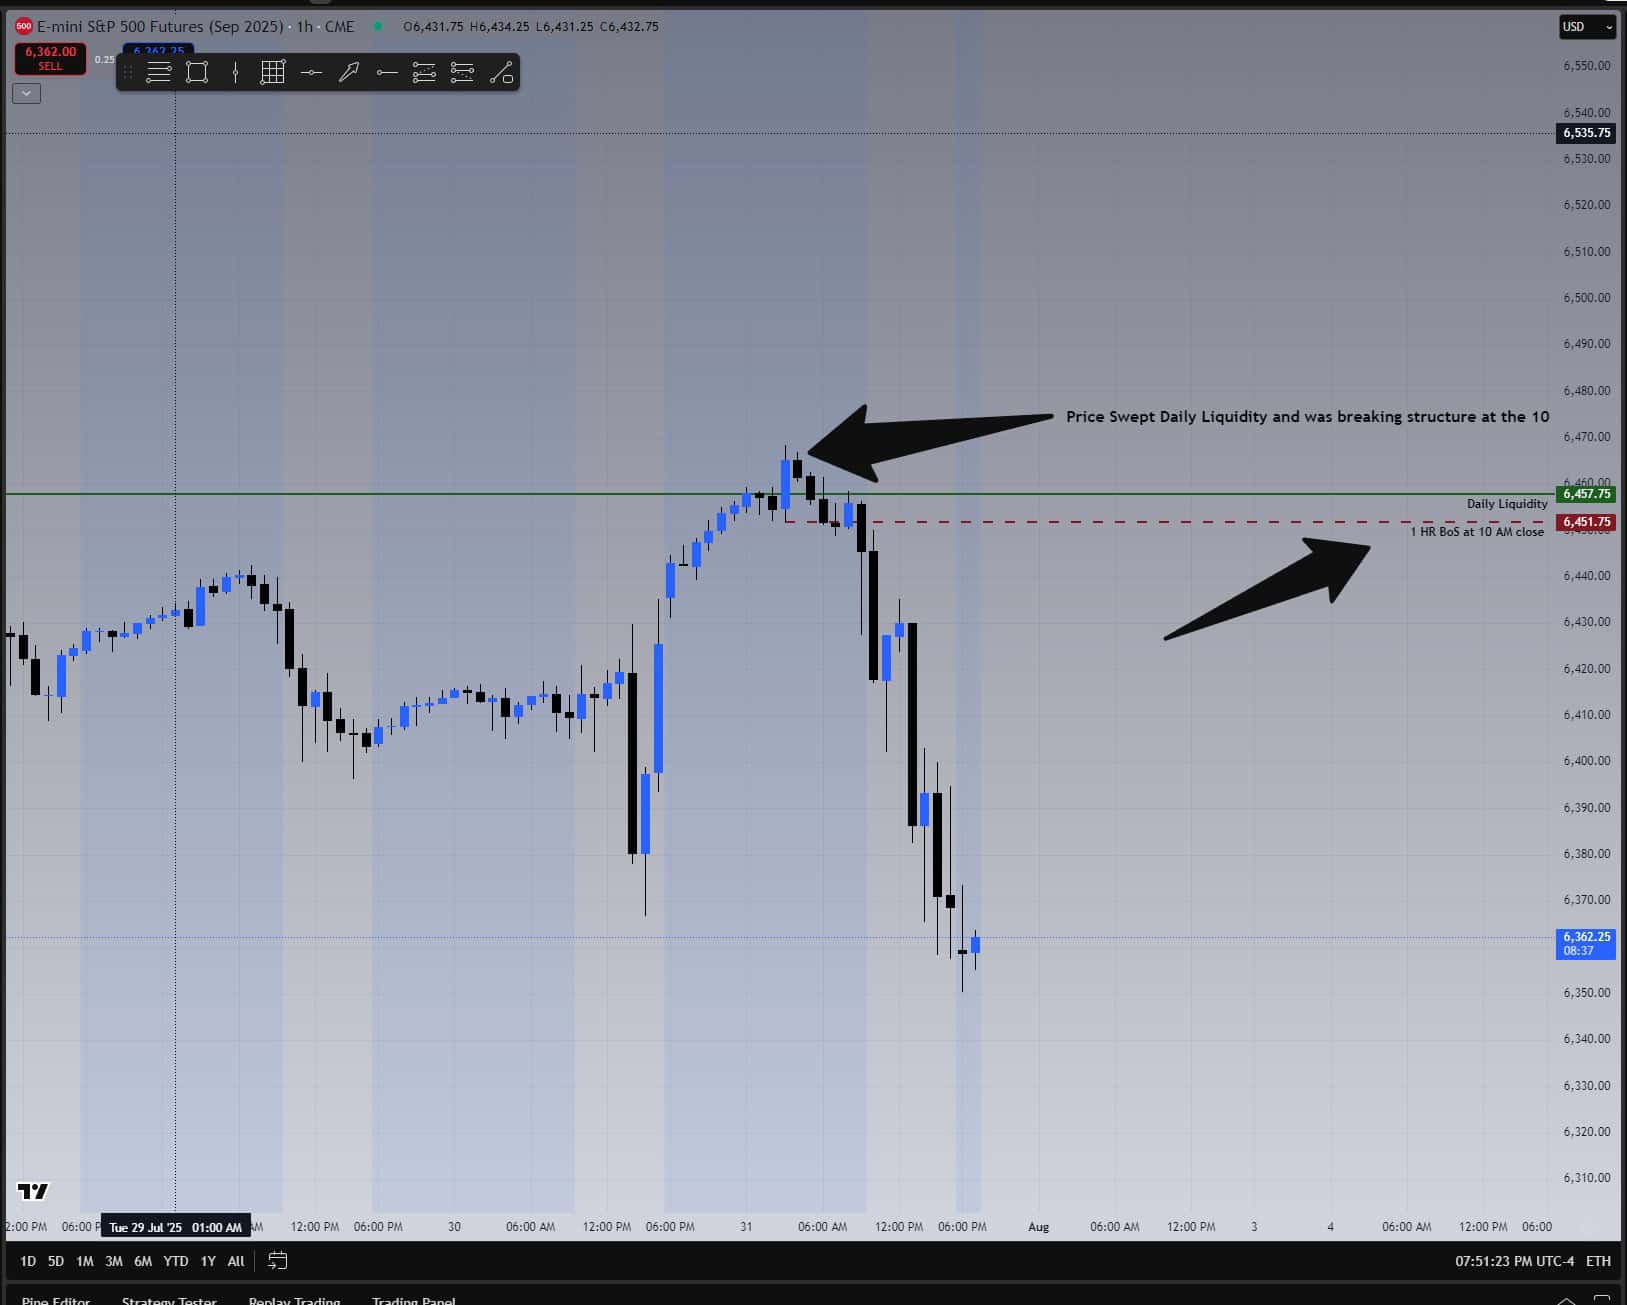
1-hour chart confirms the true bias: daily liquidity swept, then bearish structure break confirmed at 10 AM. This context sharpened the day’s takeaway.
This wasn’t the first time this has come up. Over the 11 trades so far, I’ve now identified at least 3 trades where I was on the wrong side of the higher timeframe structure. That’s not a system flaw — it’s an opportunity to improve.
📈 Why This Challenge Works
Trade 11 of 20 is in the books. But the reason this challenge is powerful has nothing to do with wins or losses.
It’s about the pattern recognition that comes from doing the same thing over and over again. You follow the plan. You record the outcomes. You refine. You learn. And slowly, clarity replaces chaos. That’s what’s happening right now.
So today, even though this trade was a winner, the real profit was in the lesson: mark the higher timeframe structure before the session. It could be the difference between a TP1 and a TP3 day. And that’s what pushes the P&L curve over the edge.
Follow the plan. Track the results. Learn from the structure. That’s how this game is won — one BoS at a time.