

Trading isn’t supposed to look simple. If it feels complex, that’s because real trading requires discipline, structure, and patience. Today’s ES September 2025 recap isn’t just about one entry and exit—it’s about showing how a clearly defined daily process guides every decision. By mapping liquidity, fair value gaps (FVGs), and Fibonacci retracements, we positioned ourselves in high-probability areas and executed with consistency.
Morning Preparation: Liquidity & Bias
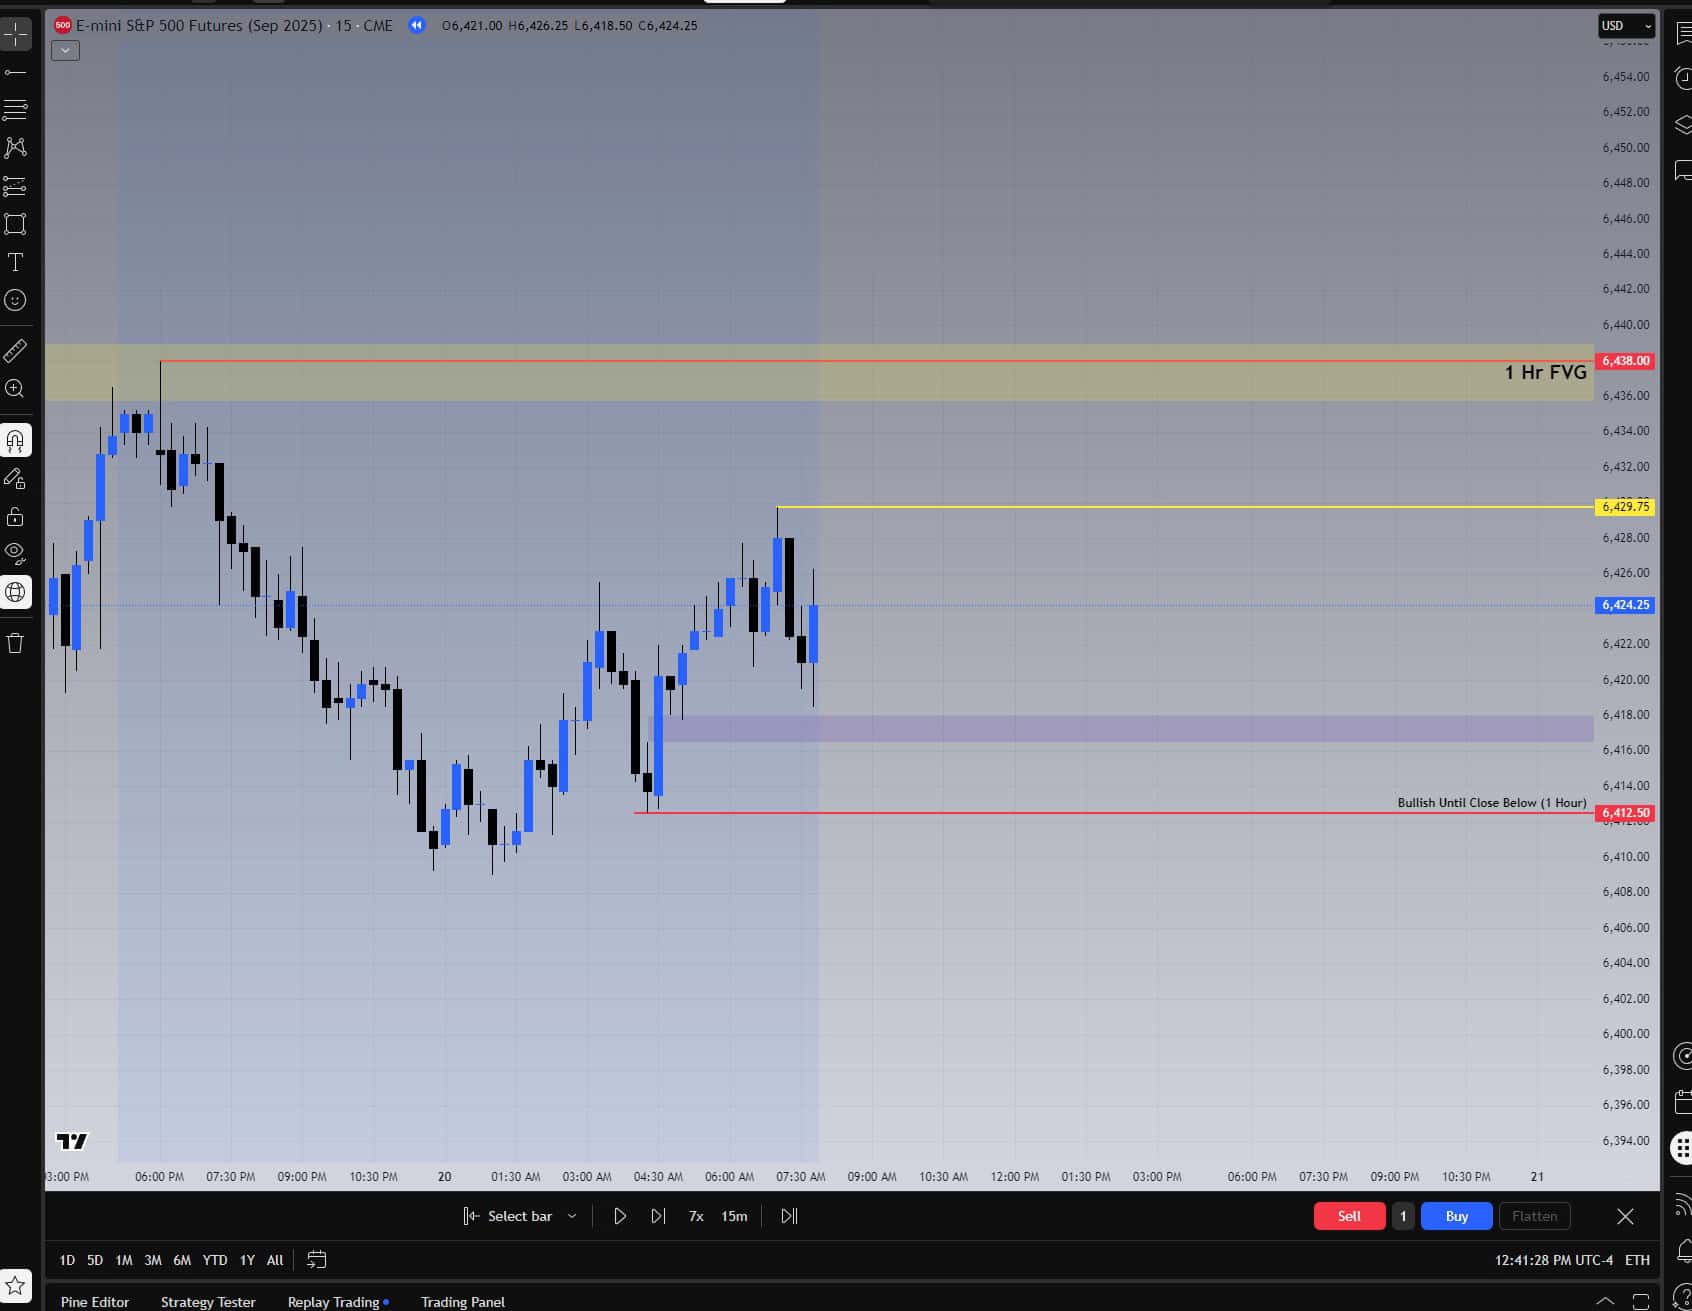
At the open of the trading day, liquidity zones were marked in red (1-hour) and yellow (15-minute), with FVGs shaded. Bias began bullish until a close below the one-hour level.
Market Open: Bias Flips
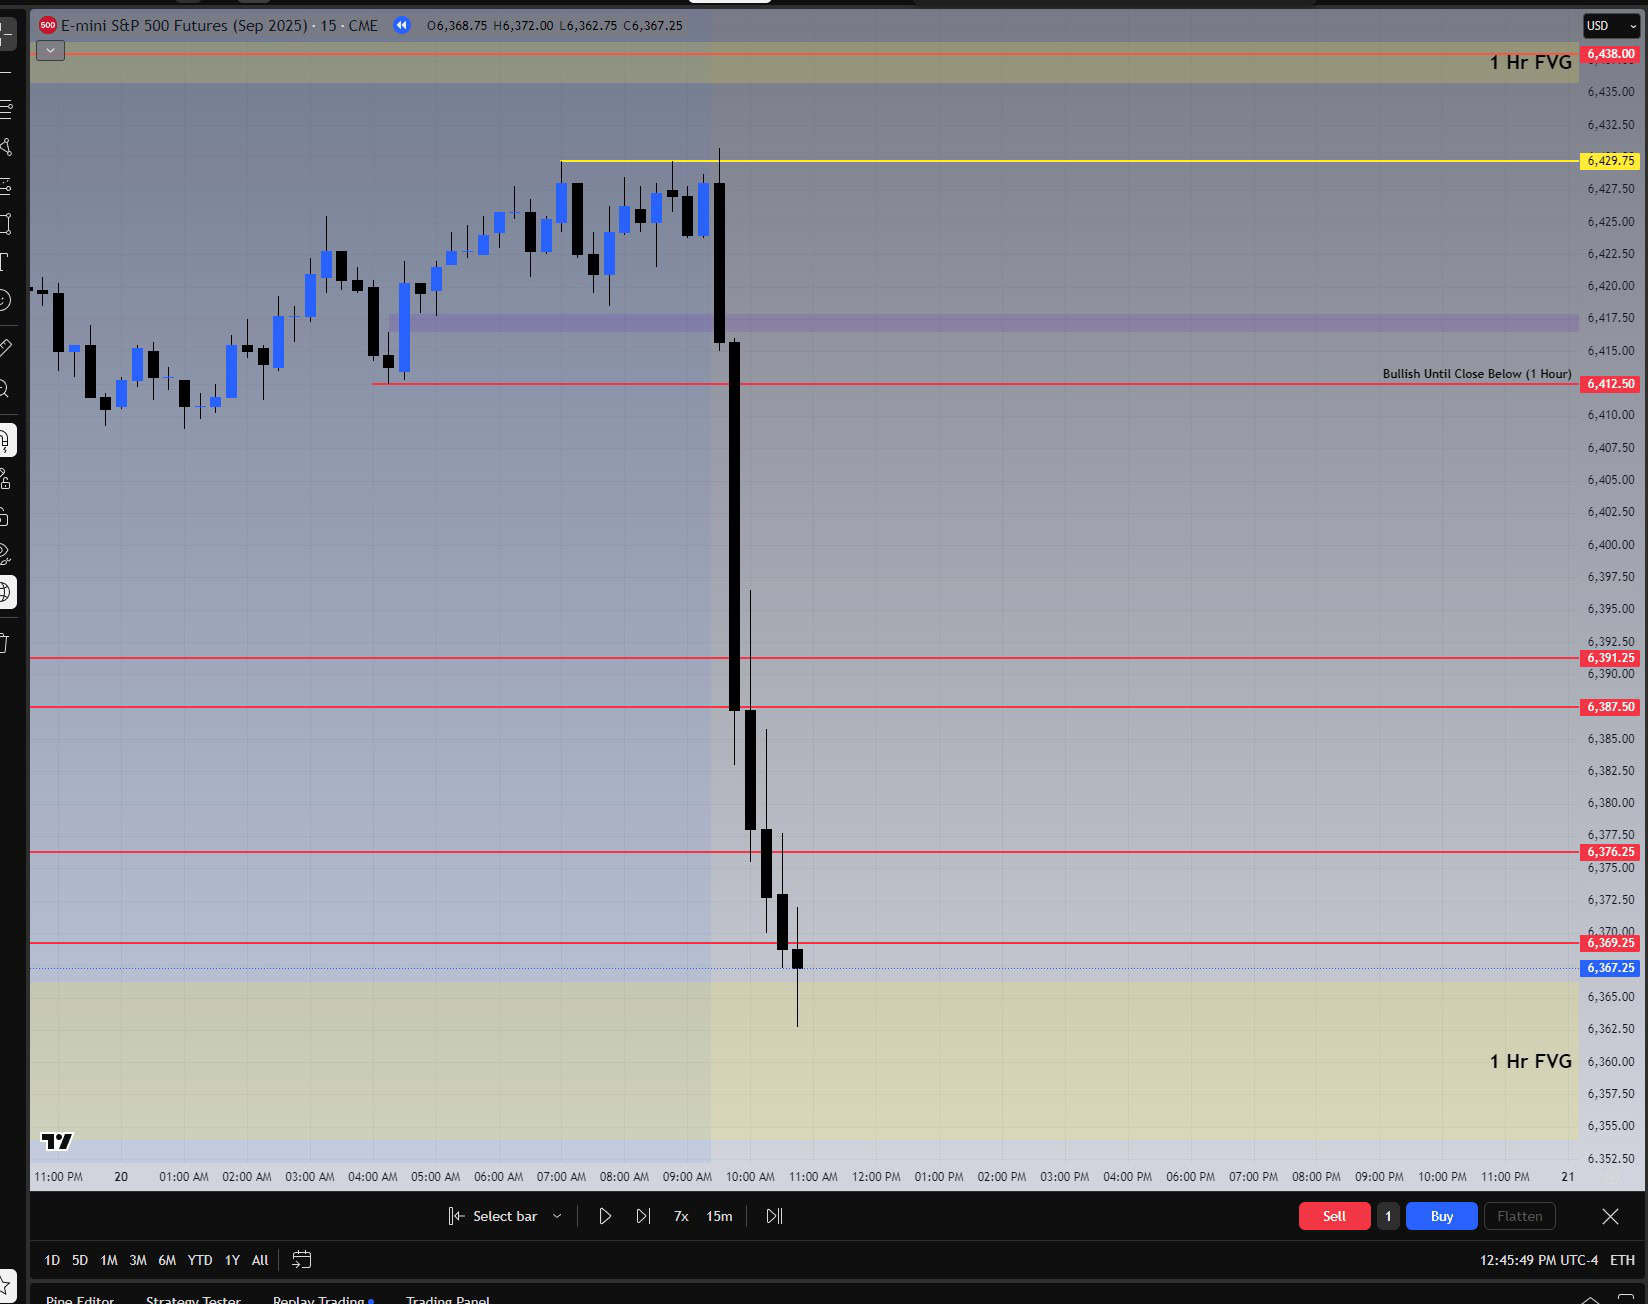
The open flipped everything—price dropped over 120 points straight through support and into the one-hour FVG. The bullish bias was gone, and structure told us to shift bearish.
Waiting for Retracement
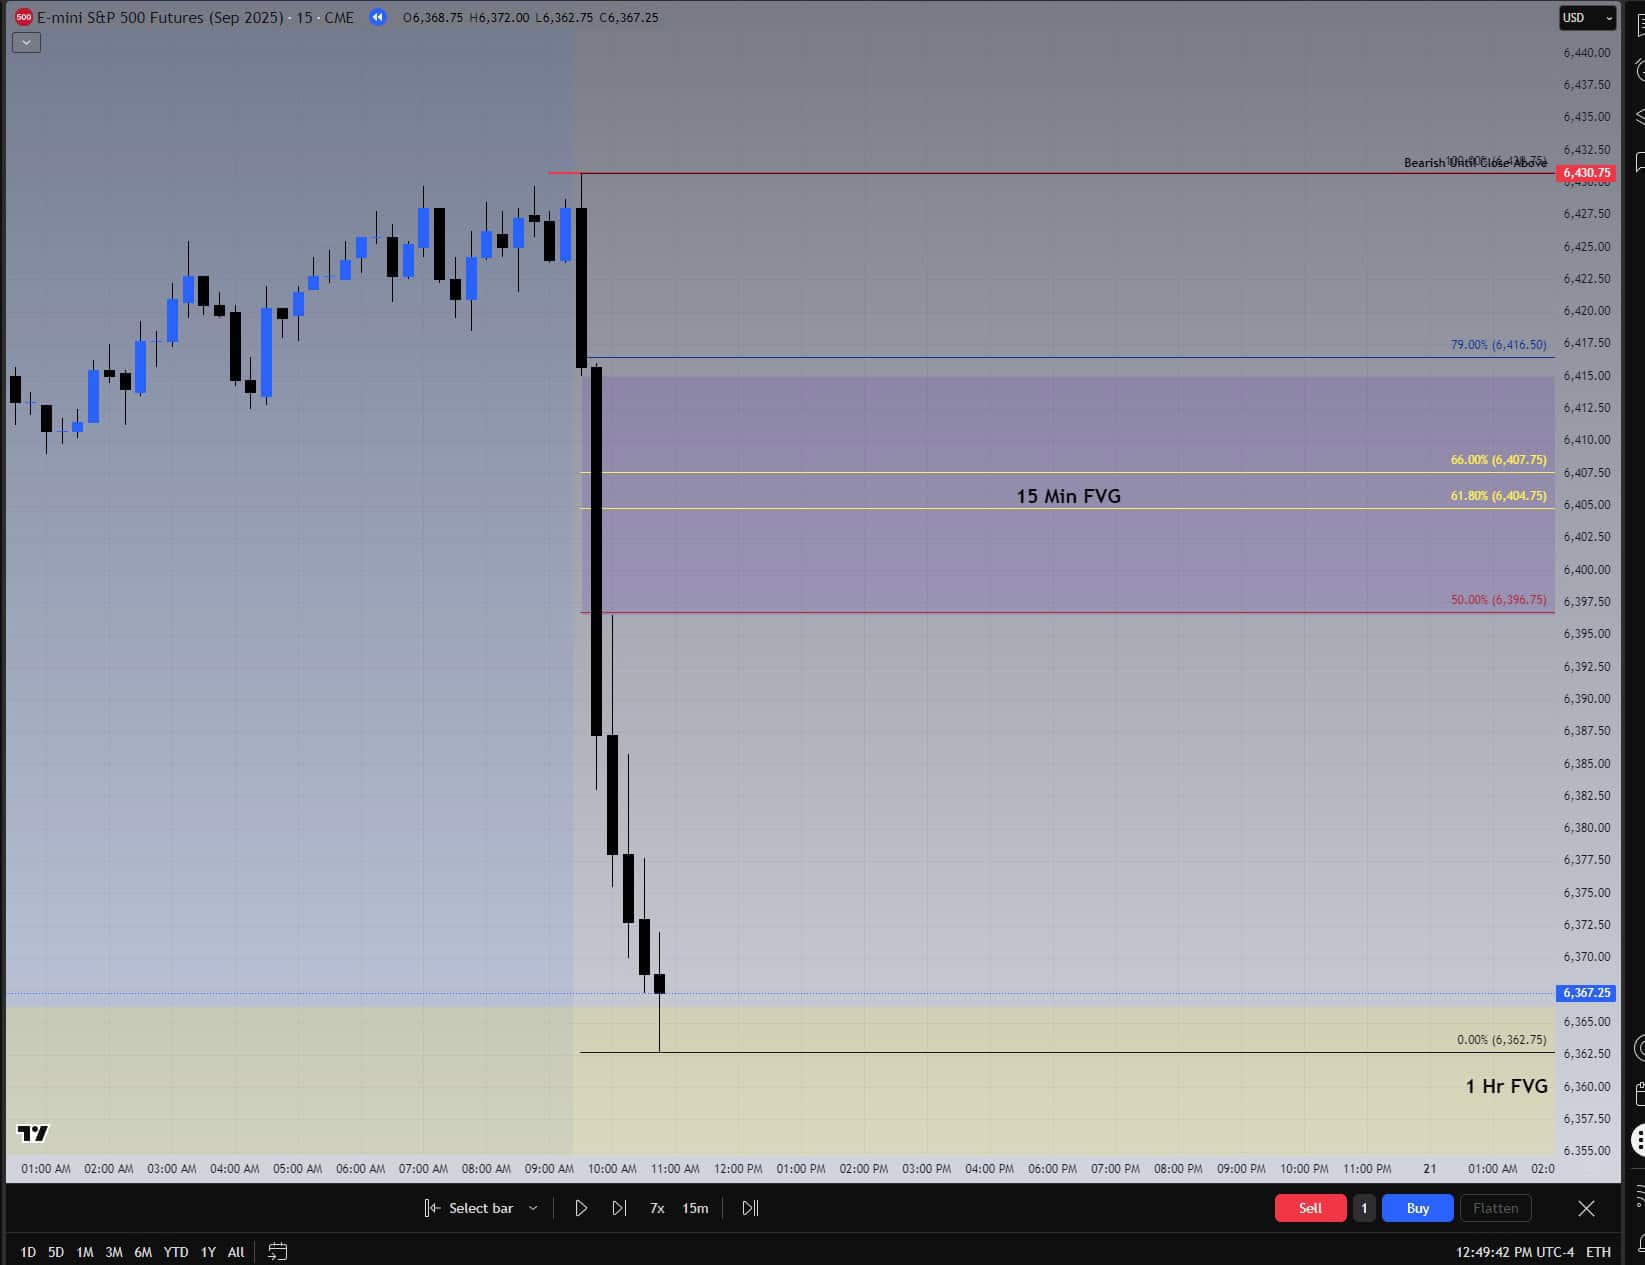
Patience is part of the process. With the chart redrawn, we waited for price to retrace into the 15-minute FVG and close to the golden pocket (61.8%–66%) before looking for shorts.
The Break of Structure (Entry Trigger)
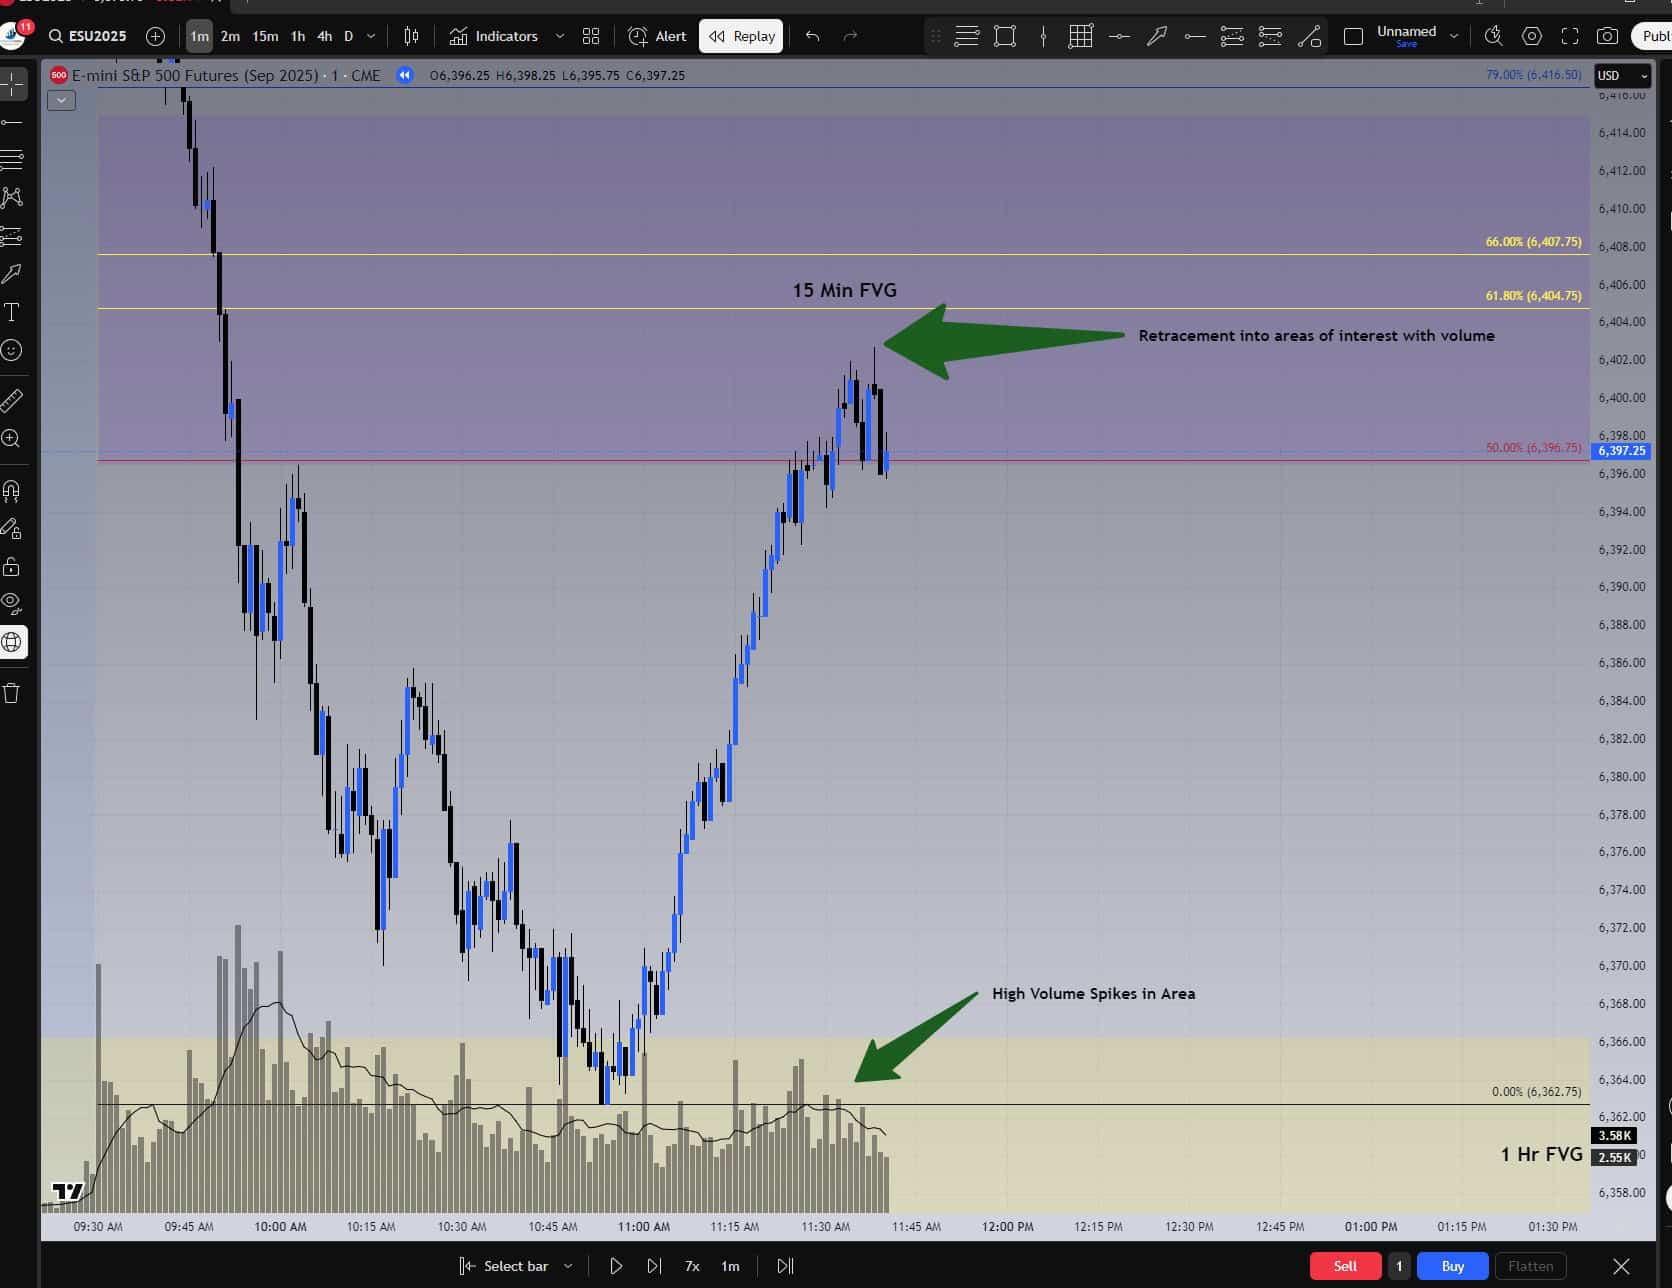
On the one-minute chart, price retraced into our zone with volume and gave a clean Break of Structure (BoS). That was the exact entry trigger we were waiting for.
Entry, Stop & TP1
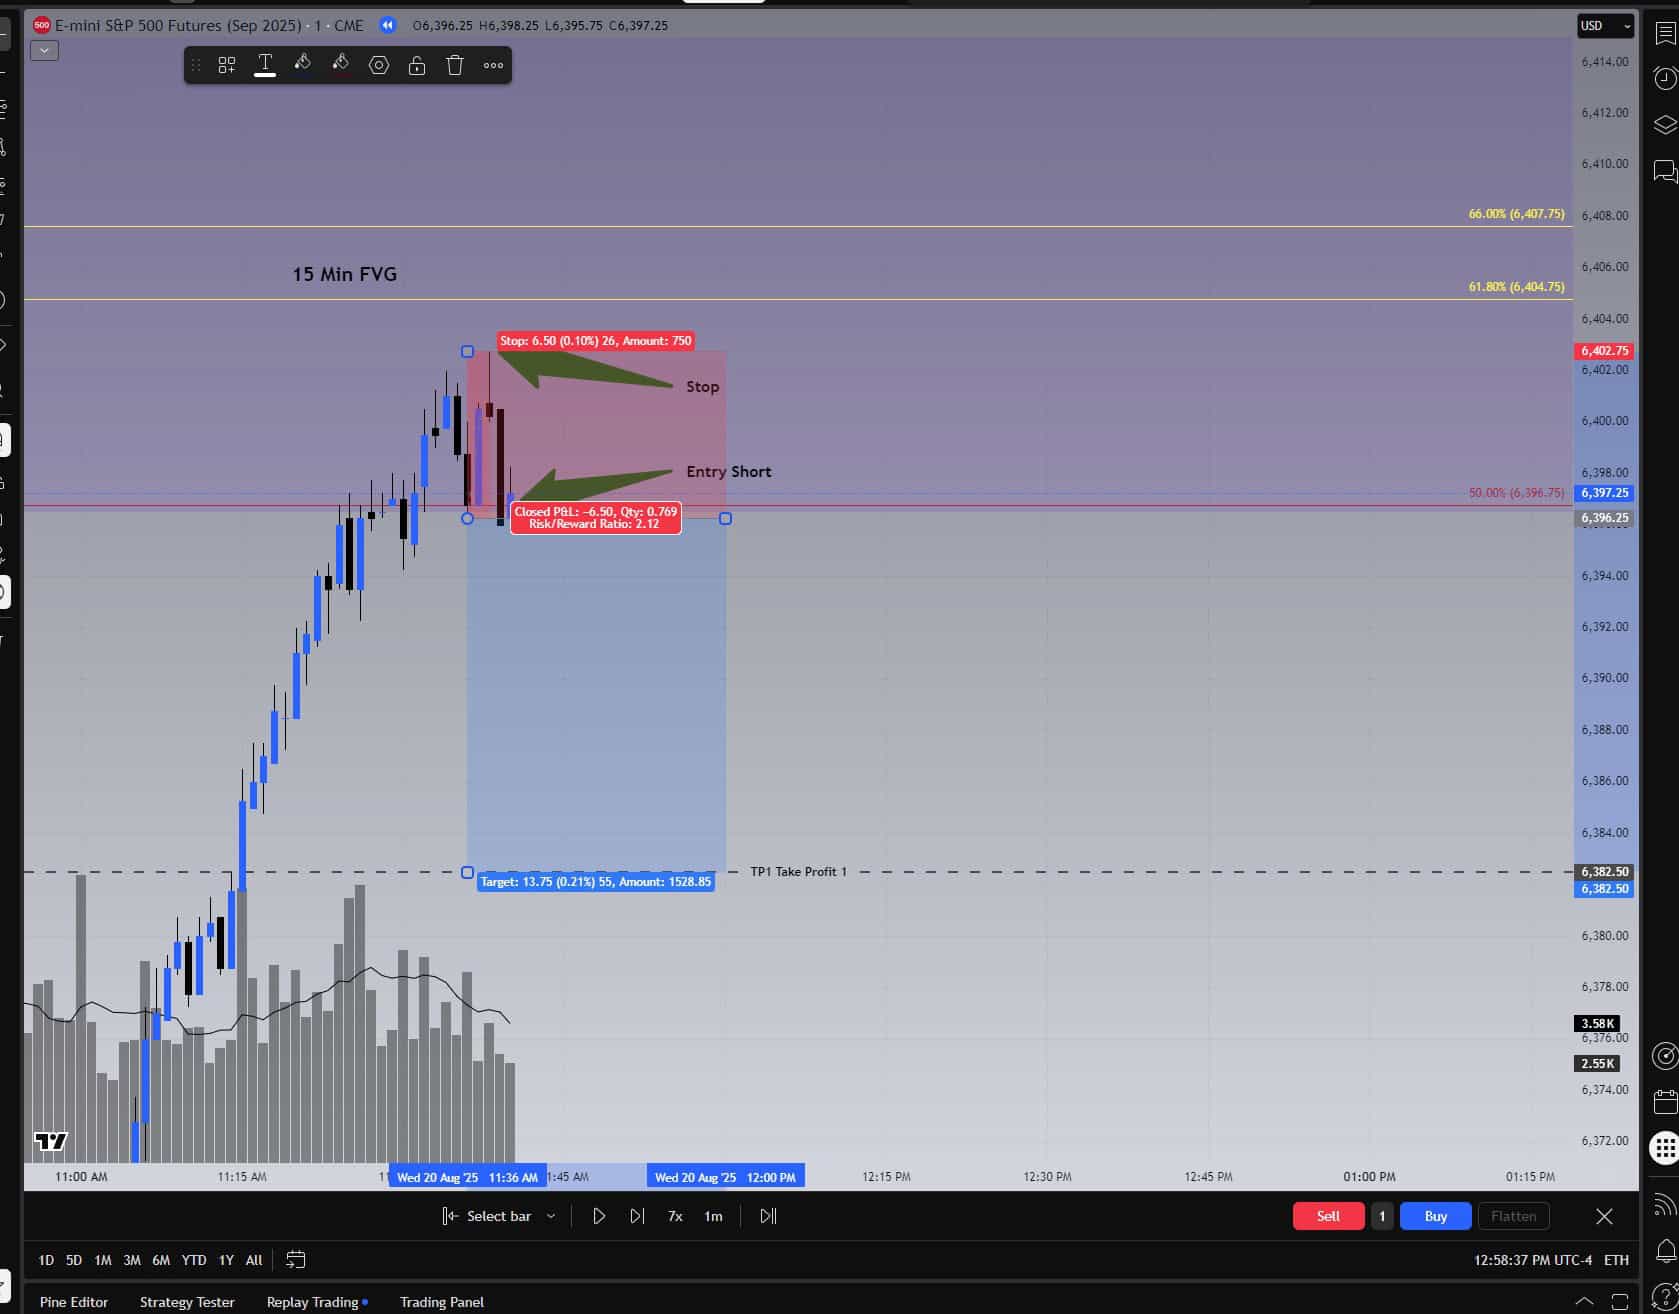
Entry, stop, and TP1 were marked before execution. The opposing 15-minute FVG bottom gave us a 1:2 risk-to-reward trade plan.
Trade Management: TP1 Hit
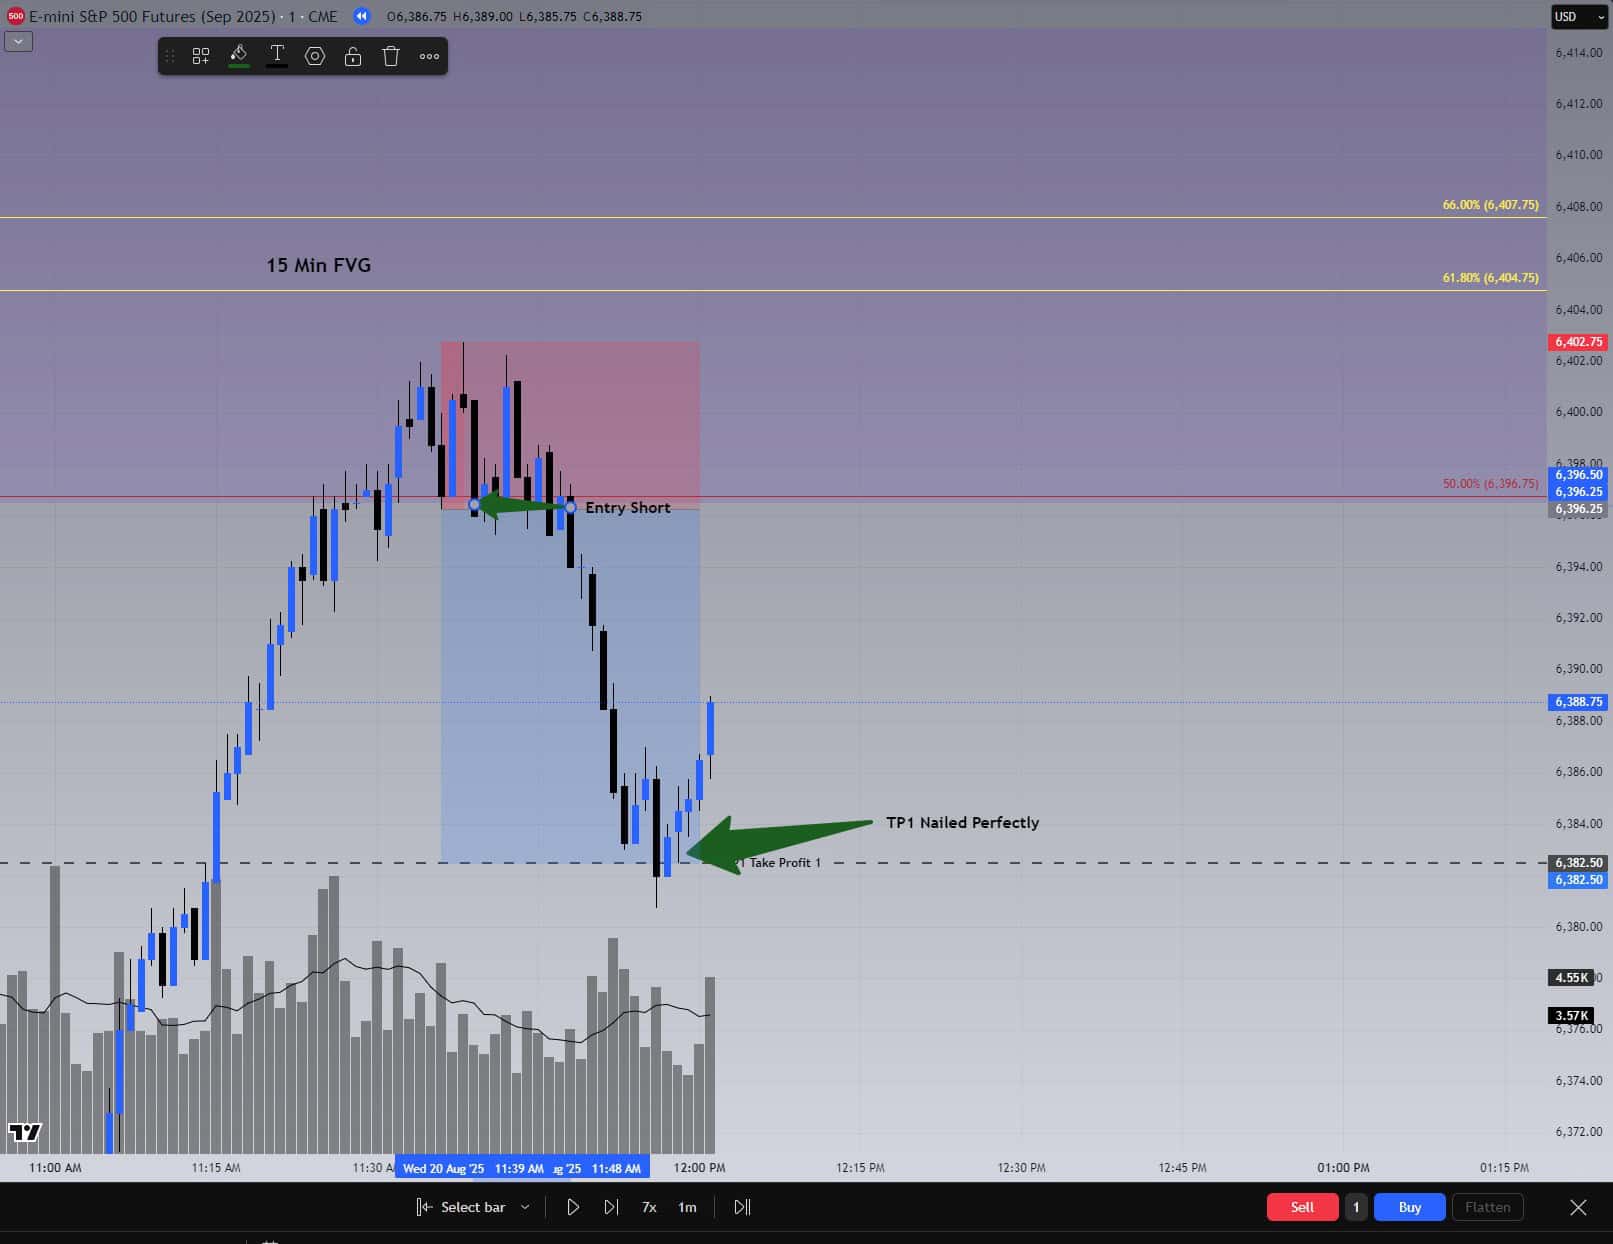
Price hit TP1 almost perfectly. We took profit, moved the rest to break-even, and were later stopped out. Controlled risk, controlled reward.
Transparency: Funded Accounts Proof
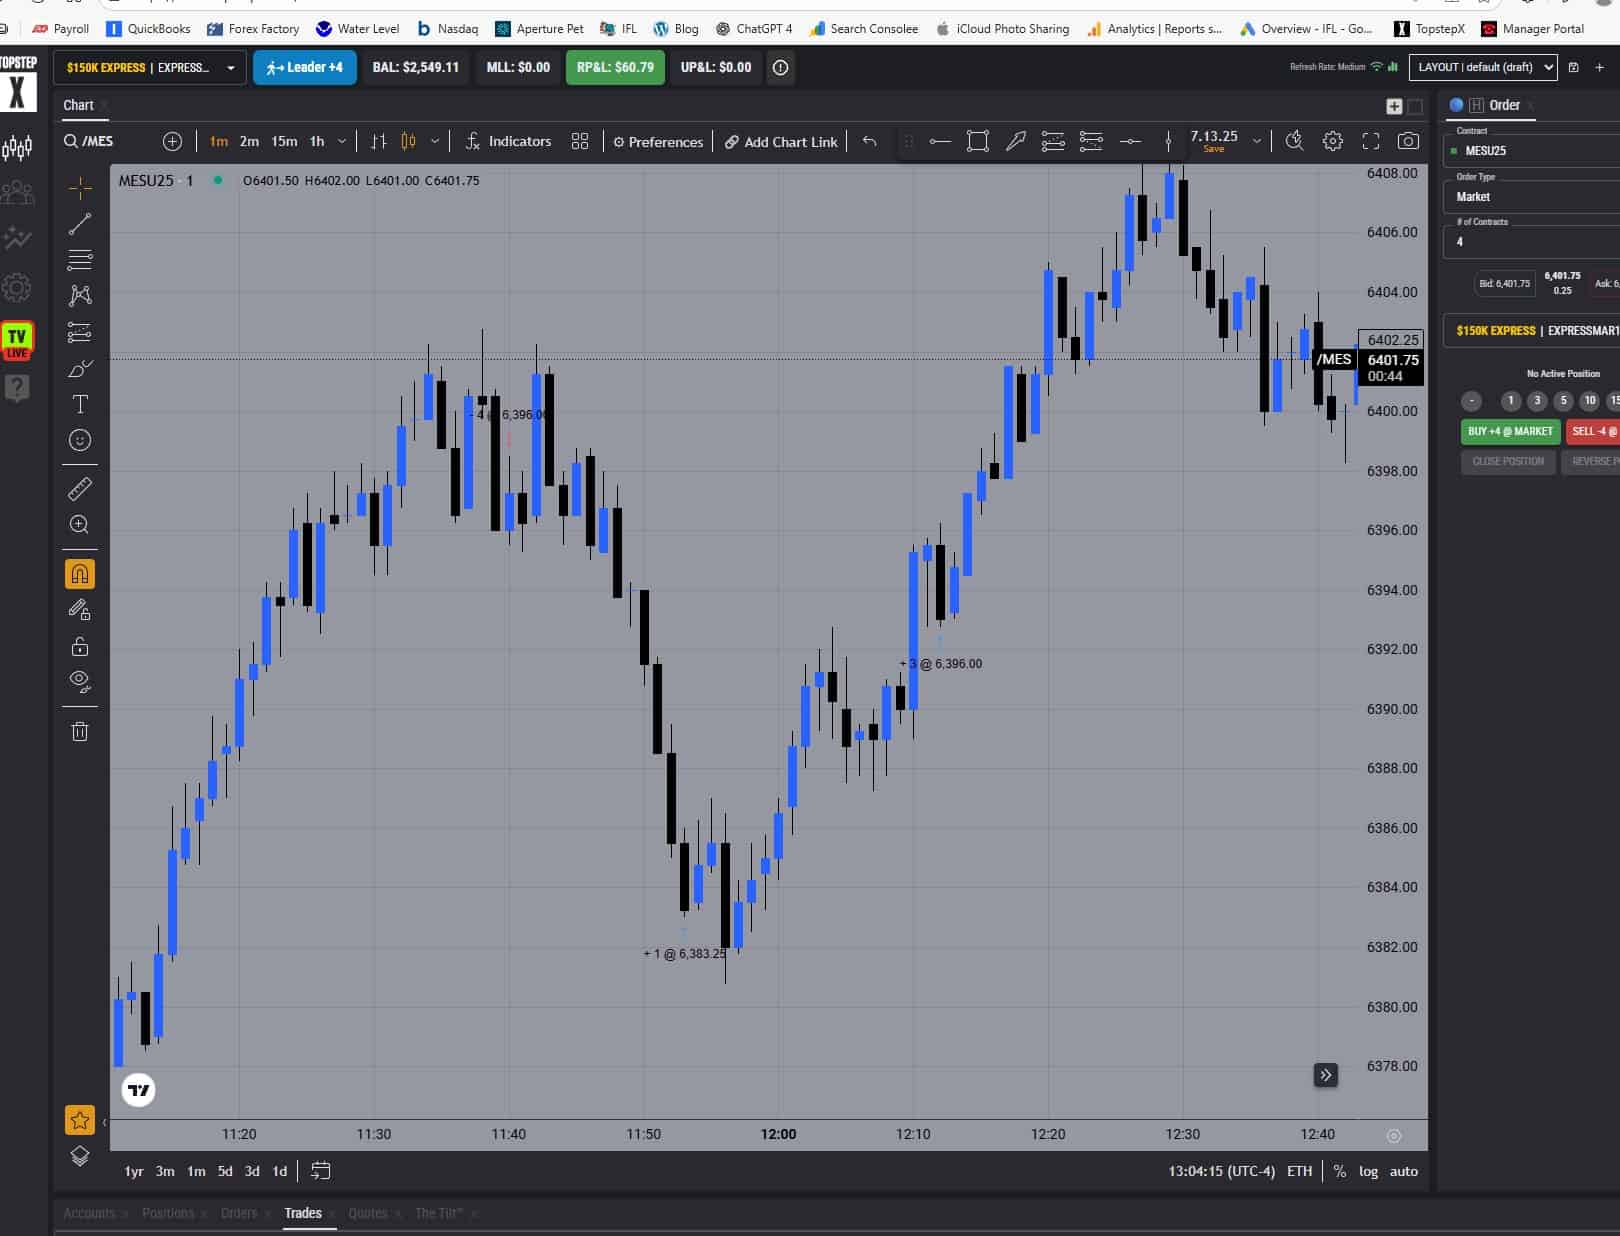
This wasn’t theory. The exact same trade was executed live across five TopStep 150K funded accounts—proof of transparency and consistency.
Aftermath: Golden Pocket Reversal
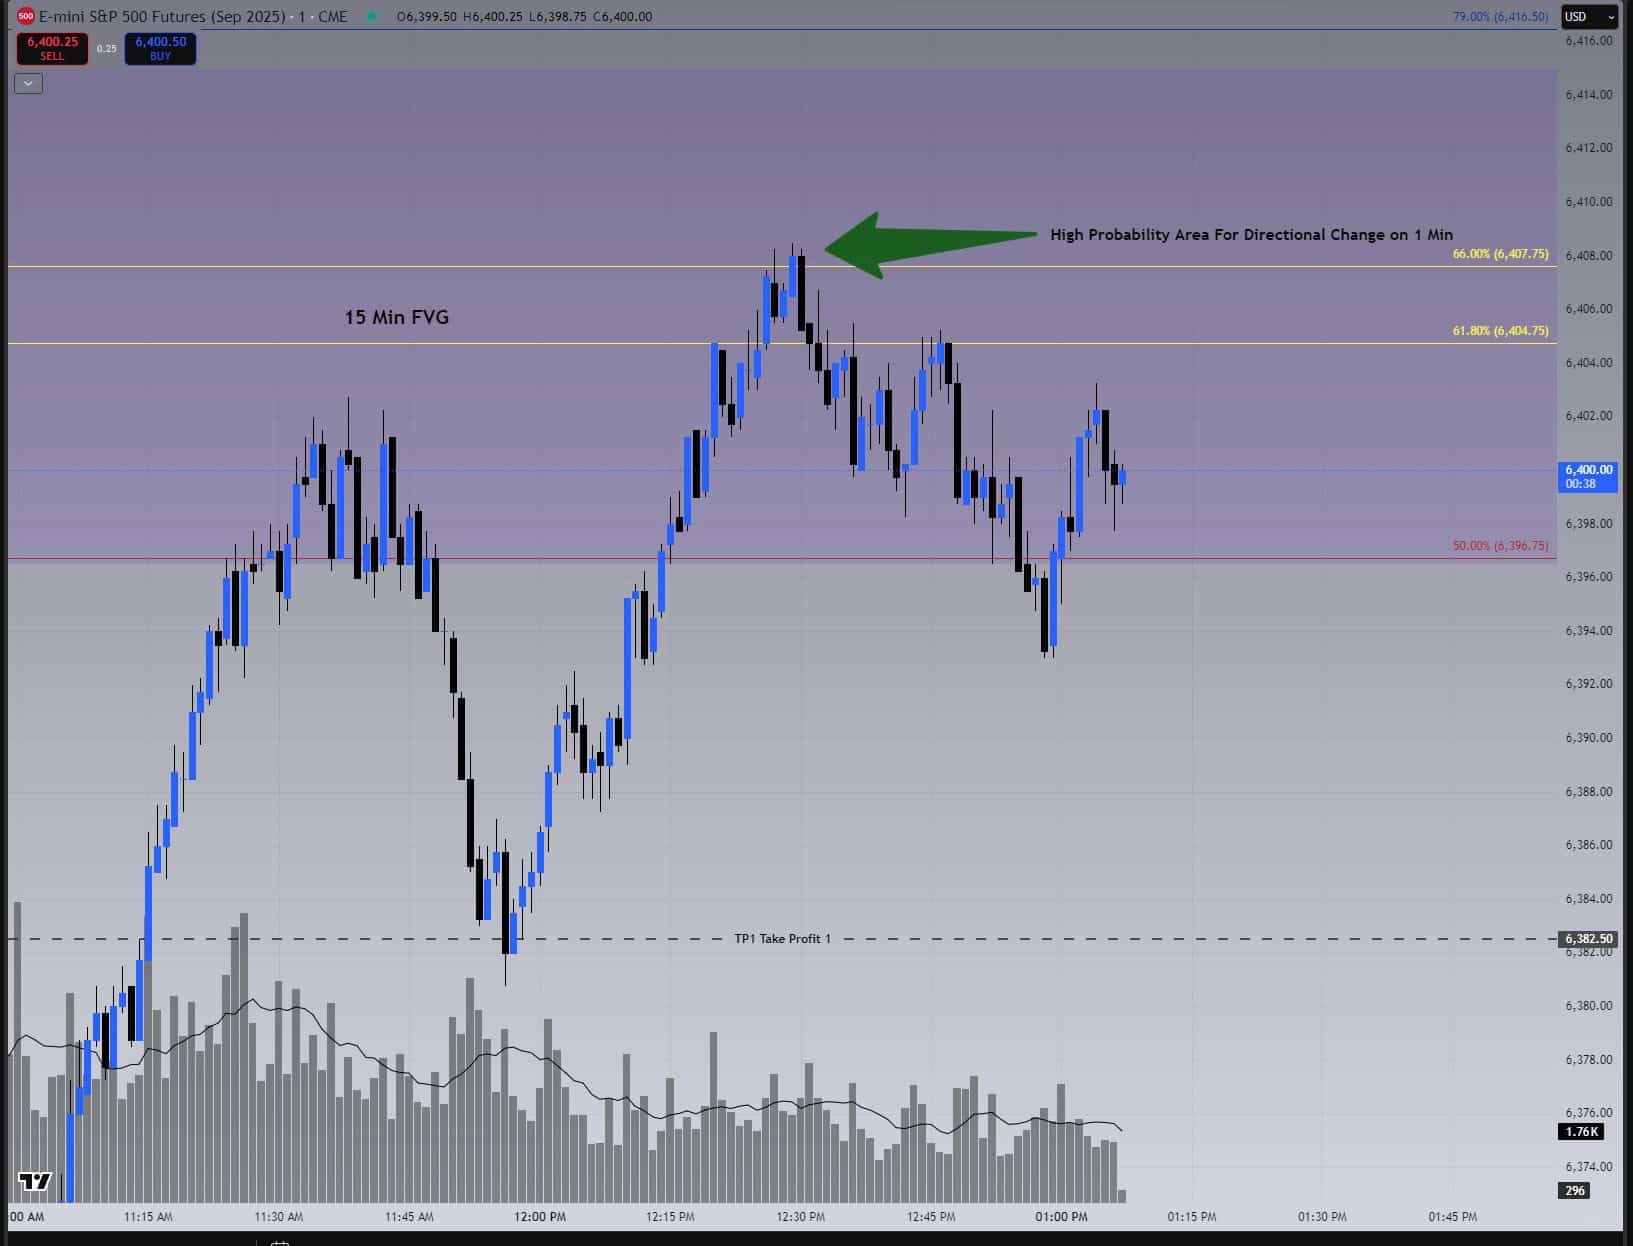
After we were out, price pressed almost perfectly into the golden pocket near 66% and then reversed. That’s the point—we don’t predict; we position ourselves where high-probability reactions occur.
Key Takeaway
This entire sequence is proof that trading is not about guessing. It’s about process:
- Define liquidity and FVGs before the session.
- Let structure flip your bias—not opinions.
- Wait for retracements into your predefined zones.
- Enter only on Break of Structure confirmations.
- Manage risk with stops and targets, not hope.
- Maintain transparency with real execution.
Position yourself between high-probability areas. That’s where trading discipline meets consistency.